Taiwanese vs Pima 2 or more Vehicles in Household
COMPARE
Taiwanese
Pima
2 or more Vehicles in Household
2 or more Vehicles in Household Comparison
Taiwanese
Pima
53.9%
2 OR MORE VEHICLES IN HOUSEHOLD
6.3/ 100
METRIC RATING
220th/ 347
METRIC RANK
52.0%
2 OR MORE VEHICLES IN HOUSEHOLD
0.2/ 100
METRIC RATING
268th/ 347
METRIC RANK
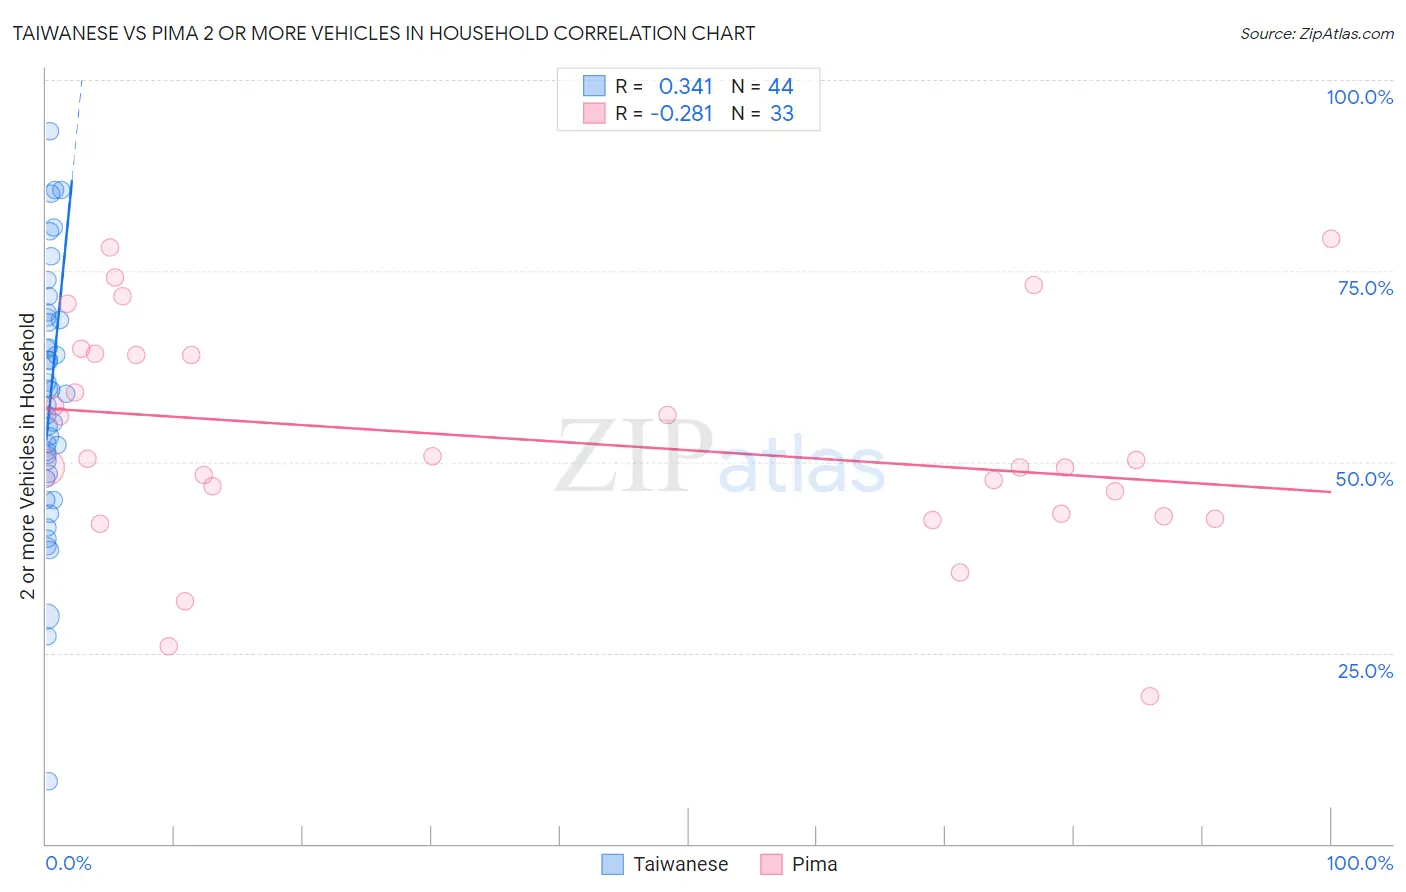
Taiwanese vs Pima 2 or more Vehicles in Household Correlation Chart
The statistical analysis conducted on geographies consisting of 31,715,954 people shows a mild positive correlation between the proportion of Taiwanese and percentage of households with 2 or more vehicles available in the United States with a correlation coefficient (R) of 0.341 and weighted average of 53.9%. Similarly, the statistical analysis conducted on geographies consisting of 61,539,452 people shows a weak negative correlation between the proportion of Pima and percentage of households with 2 or more vehicles available in the United States with a correlation coefficient (R) of -0.281 and weighted average of 52.0%, a difference of 3.6%.
2 or more Vehicles in Household Correlation Summary
| Measurement | Taiwanese | Pima |
| Minimum | 8.2% | 19.4% |
| Maximum | 93.3% | 79.2% |
| Range | 85.2% | 59.9% |
| Mean | 58.0% | 52.9% |
| Median | 58.2% | 50.2% |
| Interquartile 25% (IQ1) | 48.1% | 43.0% |
| Interquartile 75% (IQ3) | 68.8% | 64.1% |
| Interquartile Range (IQR) | 20.6% | 21.1% |
| Standard Deviation (Sample) | 17.1% | 14.6% |
| Standard Deviation (Population) | 16.9% | 14.3% |
Similar Demographics by 2 or more Vehicles in Household
Demographics Similar to Taiwanese by 2 or more Vehicles in Household
In terms of 2 or more vehicles in household, the demographic groups most similar to Taiwanese are Immigrants from Singapore (53.9%, a difference of 0.010%), South American Indian (53.9%, a difference of 0.020%), Kiowa (53.9%, a difference of 0.030%), Immigrants from Argentina (53.9%, a difference of 0.080%), and Immigrants from Burma/Myanmar (53.9%, a difference of 0.13%).
| Demographics | Rating | Rank | 2 or more Vehicles in Household |
| Guatemalans | 9.6 /100 | #213 | Tragic 54.1% |
| Immigrants | Czechoslovakia | 9.4 /100 | #214 | Tragic 54.1% |
| Aleuts | 9.3 /100 | #215 | Tragic 54.1% |
| Immigrants | Western Asia | 9.3 /100 | #216 | Tragic 54.1% |
| Immigrants | Burma/Myanmar | 7.1 /100 | #217 | Tragic 53.9% |
| Immigrants | Argentina | 6.8 /100 | #218 | Tragic 53.9% |
| South American Indians | 6.5 /100 | #219 | Tragic 53.9% |
| Taiwanese | 6.3 /100 | #220 | Tragic 53.9% |
| Immigrants | Singapore | 6.3 /100 | #221 | Tragic 53.9% |
| Kiowa | 6.2 /100 | #222 | Tragic 53.9% |
| Immigrants | Bosnia and Herzegovina | 5.5 /100 | #223 | Tragic 53.8% |
| Brazilians | 5.3 /100 | #224 | Tragic 53.8% |
| Immigrants | Egypt | 5.2 /100 | #225 | Tragic 53.8% |
| Immigrants | Eastern Africa | 5.1 /100 | #226 | Tragic 53.7% |
| Sudanese | 4.1 /100 | #227 | Tragic 53.6% |
Demographics Similar to Pima by 2 or more Vehicles in Household
In terms of 2 or more vehicles in household, the demographic groups most similar to Pima are Immigrants from Colombia (52.0%, a difference of 0.010%), Honduran (52.0%, a difference of 0.010%), Immigrants from Ireland (52.0%, a difference of 0.030%), Immigrants from France (52.0%, a difference of 0.060%), and Immigrants from Congo (52.1%, a difference of 0.20%).
| Demographics | Rating | Rank | 2 or more Vehicles in Household |
| Immigrants | Australia | 0.5 /100 | #261 | Tragic 52.4% |
| Immigrants | Northern Africa | 0.4 /100 | #262 | Tragic 52.3% |
| Immigrants | Southern Europe | 0.4 /100 | #263 | Tragic 52.3% |
| Immigrants | Latvia | 0.4 /100 | #264 | Tragic 52.2% |
| Immigrants | Congo | 0.3 /100 | #265 | Tragic 52.1% |
| Immigrants | France | 0.2 /100 | #266 | Tragic 52.0% |
| Immigrants | Colombia | 0.2 /100 | #267 | Tragic 52.0% |
| Pima | 0.2 /100 | #268 | Tragic 52.0% |
| Hondurans | 0.2 /100 | #269 | Tragic 52.0% |
| Immigrants | Ireland | 0.2 /100 | #270 | Tragic 52.0% |
| South Americans | 0.2 /100 | #271 | Tragic 51.9% |
| Sub-Saharan Africans | 0.2 /100 | #272 | Tragic 51.9% |
| Israelis | 0.2 /100 | #273 | Tragic 51.9% |
| Africans | 0.2 /100 | #274 | Tragic 51.8% |
| Immigrants | Honduras | 0.2 /100 | #275 | Tragic 51.8% |