Immigrants from Turkey vs Pima 2 or more Vehicles in Household

COMPARE

Immigrants from Turkey
Race
Ancestry
AfghanAfricanAlaska NativeAlaskan AthabascanAlbanianAleutAlsatianAmericanApacheArabArapahoArgentineanArmenianAssyrian/Chaldean/SyriacAustralianAustrianBahamianBangladeshiBarbadianBasqueBelgianBelizeanBermudanBhutaneseBlackfeetBolivianBrazilianBritishBritish West IndianBulgarianBurmeseCajunCambodianCanadianCape VerdeanCarpatho RusynCelticCentral AmericanCentral American IndianCherokeeCheyenneChickasawChileanChineseChippewaChoctawColombianColvilleComancheCosta RicanCreeCreekCroatianCrowCubanCypriotCzechCzechoslovakianDanishDelawareDominicanDutchDutch West IndianEastern EuropeanEcuadorianEgyptianEnglishEstonianEthiopianEuropeanFijianFilipinoFinnishFrenchFrench American IndianFrench CanadianGermanGerman RussianGhanaianGreekGuamanian/ChamorroGuatemalanGuyaneseHaitianHmongHonduranHopiHoumaHungarianIcelanderIndian (Asian)IndonesianInupiatIranianIraqiIrishIroquoisIsraeliItalianJamaicanJapaneseJordanianKenyanKiowaKoreanLaotianLatvianLebaneseLiberianLithuanianLumbeeLuxembourgerMacedonianMalaysianMalteseMarshalleseMenomineeMexicanMexican American IndianMongolianMoroccanNative HawaiianNavajoNepaleseNew ZealanderNicaraguanNigerianNorthern EuropeanNorwegianOkinawanOsageOttawaPaiutePakistaniPalestinianPanamanianParaguayanPennsylvania GermanPeruvianPolishPortuguesePotawatomiPuebloPuerto RicanPuget Sound SalishRomanianRussianSalvadoranSamoanScandinavianScotch-IrishScottishSeminoleSenegaleseSerbianShoshoneSierra LeoneanSiouxSlavicSlovakSloveneSomaliSouth AfricanSouth AmericanSouth American IndianSoviet UnionSpaniardSpanishSpanish AmericanSpanish American IndianSri LankanSubsaharan AfricanSudaneseSwedishSwissSyrianTaiwaneseThaiTlingit-HaidaTohono O'OdhamTonganTrinidadian and TobagonianTsimshianTurkishU.S. Virgin IslanderUgandanUkrainianUruguayanUteVenezuelanVietnameseWelshWest IndianYakamaYaquiYugoslavianYumanYup'ikZimbabwean
Immigration
NonimmigrantsImmigrantsAfghanistanAfricaAlbaniaArgentinaArmeniaAsiaAustraliaAustriaBahamasBangladeshBarbadosBelarusBelgiumBelizeBoliviaBosnia and HerzegovinaBrazilBulgariaBurma/MyanmarCabo VerdeCambodiaCameroonCanadaCaribbeanCentral AmericaChileChinaColombiaCongoCosta RicaCroatiaCubaCzechoslovakiaDenmarkDominicaDominican RepublicEastern AfricaEastern AsiaEastern EuropeEcuadorEgyptEl SalvadorEnglandEritreaEthiopiaEuropeFijiFranceGermanyGhanaGreeceGrenadaGuatemalaGuyanaHaitiHondurasHong KongHungaryIndiaIndonesiaIranIraqIrelandIsraelItalyJamaicaJapanJordanKazakhstanKenyaKoreaKuwaitLaosLatin AmericaLatviaLebanonLiberiaLithuaniaMalaysiaMexicoMicronesiaMiddle AfricaMoldovaMoroccoNepalNetherlandsNicaraguaNigeriaNorth AmericaNorth MacedoniaNorthern AfricaNorthern EuropeNorwayOceaniaPakistanPanamaPeruPhilippinesPolandPortugalRomaniaRussiaSaudi ArabiaScotlandSenegalSerbiaSierra LeoneSingaporeSomaliaSouth AfricaSouth AmericaSouth Central AsiaSouth Eastern AsiaSouthern EuropeSpainSri LankaSt. Vincent and the GrenadinesSudanSwedenSwitzerlandSyriaTaiwanThailandTrinidad and TobagoTurkeyUgandaUkraineUruguayUzbekistanVenezuelaVietnamWest IndiesWestern AfricaWestern AsiaWestern EuropeYemenZaireZimbabweAzores
Pima
Race
Ancestry
AfghanAfricanAlaska NativeAlaskan AthabascanAlbanianAleutAlsatianAmericanApacheArabArapahoArgentineanArmenianAssyrian/Chaldean/SyriacAustralianAustrianBahamianBangladeshiBarbadianBasqueBelgianBelizeanBermudanBhutaneseBlackfeetBolivianBrazilianBritishBritish West IndianBulgarianBurmeseCajunCambodianCanadianCape VerdeanCarpatho RusynCelticCentral AmericanCentral American IndianCherokeeCheyenneChickasawChileanChineseChippewaChoctawColombianColvilleComancheCosta RicanCreeCreekCroatianCrowCubanCypriotCzechCzechoslovakianDanishDelawareDominicanDutchDutch West IndianEastern EuropeanEcuadorianEgyptianEnglishEstonianEthiopianEuropeanFijianFilipinoFinnishFrenchFrench American IndianFrench CanadianGermanGerman RussianGhanaianGreekGuamanian/ChamorroGuatemalanGuyaneseHaitianHmongHonduranHopiHoumaHungarianIcelanderIndian (Asian)IndonesianInupiatIranianIraqiIrishIroquoisIsraeliItalianJamaicanJapaneseJordanianKenyanKiowaKoreanLaotianLatvianLebaneseLiberianLithuanianLumbeeLuxembourgerMacedonianMalaysianMalteseMarshalleseMenomineeMexicanMexican American IndianMongolianMoroccanNative HawaiianNavajoNepaleseNew ZealanderNicaraguanNigerianNorthern EuropeanNorwegianOkinawanOsageOttawaPaiutePakistaniPalestinianPanamanianParaguayanPennsylvania GermanPeruvianPimaPolishPortuguesePotawatomiPuebloPuerto RicanPuget Sound SalishRomanianRussianSalvadoranSamoanScandinavianScotch-IrishScottishSeminoleSenegaleseSerbianShoshoneSierra LeoneanSiouxSlavicSlovakSloveneSomaliSouth AfricanSouth AmericanSouth American IndianSoviet UnionSpaniardSpanishSpanish AmericanSpanish American IndianSri LankanSubsaharan AfricanSudaneseSwedishSwissSyrianTaiwaneseThaiTlingit-HaidaTohono O'OdhamTonganTrinidadian and TobagonianTsimshianTurkishU.S. Virgin IslanderUgandanUkrainianUruguayanUteVenezuelanVietnameseWelshWest IndianYakamaYaquiYugoslavianYumanYup'ikZimbabwean
Immigration
NonimmigrantsImmigrantsAfghanistanAfricaAlbaniaArgentinaArmeniaAsiaAustraliaAustriaBahamasBangladeshBarbadosBelarusBelgiumBelizeBoliviaBosnia and HerzegovinaBrazilBulgariaBurma/MyanmarCabo VerdeCambodiaCameroonCanadaCaribbeanCentral AmericaChileChinaColombiaCongoCosta RicaCroatiaCubaCzechoslovakiaDenmarkDominicaDominican RepublicEastern AfricaEastern AsiaEastern EuropeEcuadorEgyptEl SalvadorEnglandEritreaEthiopiaEuropeFijiFranceGermanyGhanaGreeceGrenadaGuatemalaGuyanaHaitiHondurasHong KongHungaryIndiaIndonesiaIranIraqIrelandIsraelItalyJamaicaJapanJordanKazakhstanKenyaKoreaKuwaitLaosLatin AmericaLatviaLebanonLiberiaLithuaniaMalaysiaMexicoMicronesiaMiddle AfricaMoldovaMoroccoNepalNetherlandsNicaraguaNigeriaNorth AmericaNorth MacedoniaNorthern AfricaNorthern EuropeNorwayOceaniaPakistanPanamaPeruPhilippinesPolandPortugalRomaniaRussiaSaudi ArabiaScotlandSenegalSerbiaSierra LeoneSingaporeSomaliaSouth AfricaSouth AmericaSouth Central AsiaSouth Eastern AsiaSouthern EuropeSpainSri LankaSt. Vincent and the GrenadinesSudanSwedenSwitzerlandSyriaTaiwanThailandTrinidad and TobagoUgandaUkraineUruguayUzbekistanVenezuelaVietnamWest IndiesWestern AfricaWestern AsiaWestern EuropeYemenZaireZimbabweAzores
2 or more Vehicles in Household
Income
Poverty
Unemployment
Labor Participation
Family Structure
Vehicle Availability
Education Level
Disability

2 or more Vehicles in Household Comparison

Immigrants from Turkey

Pima

Tragic
Tragic
53.6%
2 OR MORE VEHICLES IN HOUSEHOLD
3.8/ 100
METRIC RATING
229th/ 347
METRIC RANK
52.0%
2 OR MORE VEHICLES IN HOUSEHOLD
0.2/ 100
METRIC RATING
268th/ 347
METRIC RANK

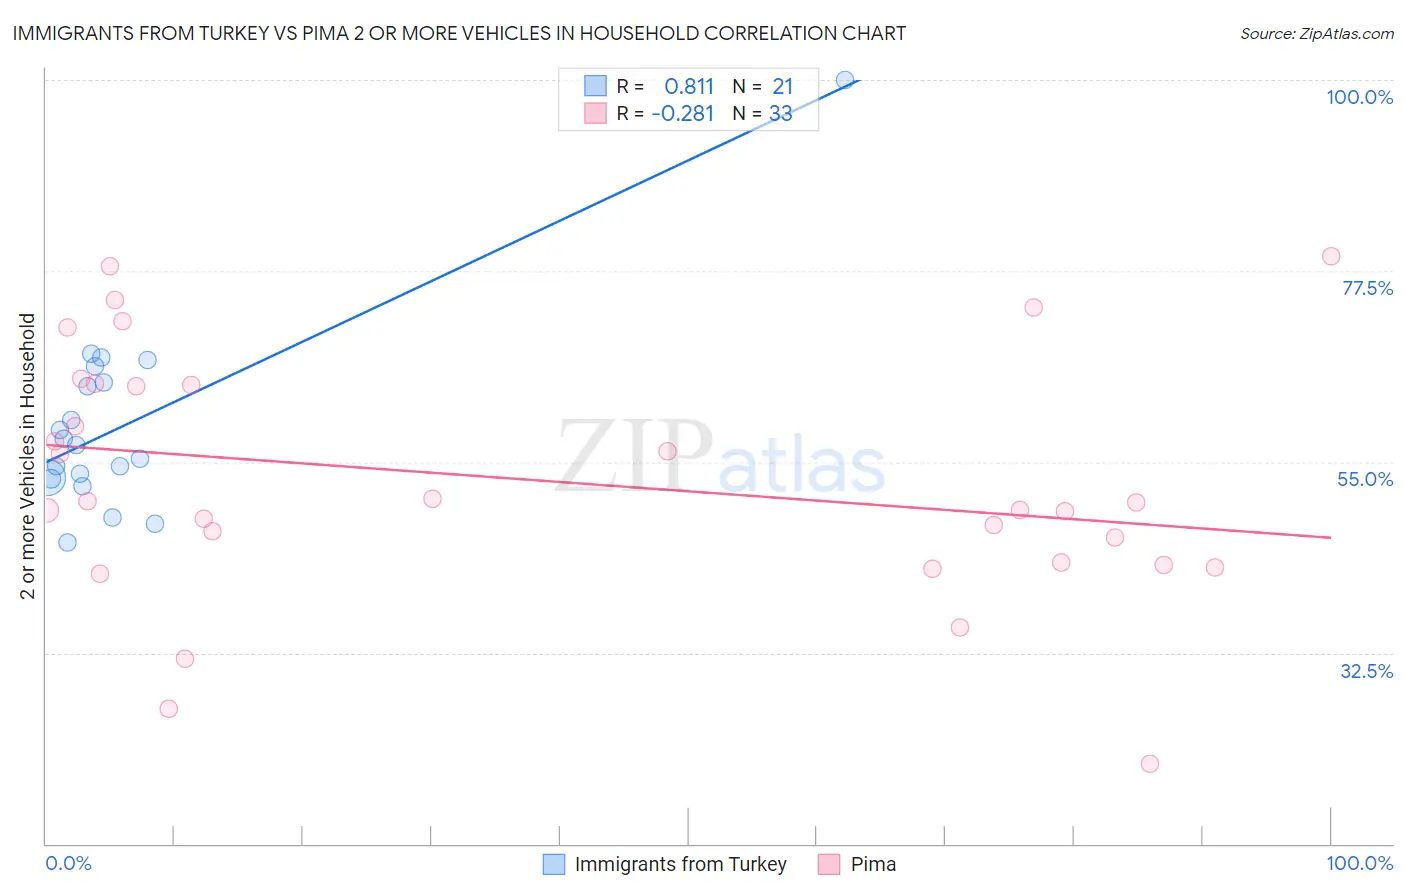
Immigrants from Turkey vs Pima 2 or more Vehicles in Household Correlation Chart

The statistical analysis conducted on geographies consisting of 222,983,528 people shows a very strong positive correlation between the proportion of Immigrants from Turkey and percentage of households with 2 or more vehicles available in the United States with a correlation coefficient (R) of 0.811 and weighted average of 53.6%. Similarly, the statistical analysis conducted on geographies consisting of 61,539,452 people shows a weak negative correlation between the proportion of Pima and percentage of households with 2 or more vehicles available in the United States with a correlation coefficient (R) of -0.281 and weighted average of 52.0%, a difference of 3.0%.
Immigrants from Turkey vs Pima 2 or more Vehicles in Household

2 or more Vehicles in Household Correlation Summary

MeasurementImmigrants from TurkeyPima
Minimum45.6%19.4%
Maximum100.0%79.2%
Range54.4%59.9%
Mean59.4%52.9%
Median57.0%50.2%
Interquartile 25% (IQ1)53.1%43.0%
Interquartile 75% (IQ3)65.3%64.1%
Interquartile Range (IQR)12.2%21.1%
Standard Deviation (Sample)11.4%14.6%
Standard Deviation (Population)11.2%14.3%

Similar Demographics by 2 or more Vehicles in Household

Demographics Similar to Immigrants from Turkey by 2 or more Vehicles in Household

In terms of 2 or more vehicles in household, the demographic groups most similar to Immigrants from Turkey are Alaska Native (53.6%, a difference of 0.020%), Immigrants from Nepal (53.5%, a difference of 0.060%), Sudanese (53.6%, a difference of 0.080%), Panamanian (53.5%, a difference of 0.11%), and Immigrants from Guatemala (53.5%, a difference of 0.18%).
DemographicsRating | Rank2 or more Vehicles in Household
Kiowa
6.2
/100
|
#222
Tragic
53.9%
Immigrants | Bosnia and Herzegovina
5.5
/100
|
#223
Tragic
53.8%
Brazilians
5.3
/100
|
#224
Tragic
53.8%
Immigrants | Egypt
5.2
/100
|
#225
Tragic
53.8%
Immigrants | Eastern Africa
5.1
/100
|
#226
Tragic
53.7%
Sudanese
4.1
/100
|
#227
Tragic
53.6%
Alaska Natives
3.9
/100
|
#228
Tragic
53.6%
Immigrants | Turkey
3.8
/100
|
#229
Tragic
53.6%
Immigrants | Nepal
3.6
/100
|
#230
Tragic
53.5%
Panamanians
3.4
/100
|
#231
Tragic
53.5%
Immigrants | Guatemala
3.2
/100
|
#232
Tragic
53.5%
Ugandans
3.2
/100
|
#233
Tragic
53.5%
Immigrants | Switzerland
3.0
/100
|
#234
Tragic
53.4%
Immigrants | Middle Africa
3.0
/100
|
#235
Tragic
53.4%
Indonesians
2.7
/100
|
#236
Tragic
53.4%

Demographics Similar to Pima by 2 or more Vehicles in Household

In terms of 2 or more vehicles in household, the demographic groups most similar to Pima are Immigrants from Colombia (52.0%, a difference of 0.010%), Honduran (52.0%, a difference of 0.010%), Immigrants from Ireland (52.0%, a difference of 0.030%), Immigrants from France (52.0%, a difference of 0.060%), and Immigrants from Congo (52.1%, a difference of 0.20%).
DemographicsRating | Rank2 or more Vehicles in Household
Immigrants | Australia
0.5
/100
|
#261
Tragic
52.4%
Immigrants | Northern Africa
0.4
/100
|
#262
Tragic
52.3%
Immigrants | Southern Europe
0.4
/100
|
#263
Tragic
52.3%
Immigrants | Latvia
0.4
/100
|
#264
Tragic
52.2%
Immigrants | Congo
0.3
/100
|
#265
Tragic
52.1%
Immigrants | France
0.2
/100
|
#266
Tragic
52.0%
Immigrants | Colombia
0.2
/100
|
#267
Tragic
52.0%
Pima
0.2
/100
|
#268
Tragic
52.0%
Hondurans
0.2
/100
|
#269
Tragic
52.0%
Immigrants | Ireland
0.2
/100
|
#270
Tragic
52.0%
South Americans
0.2
/100
|
#271
Tragic
51.9%
Sub-Saharan Africans
0.2
/100
|
#272
Tragic
51.9%
Israelis
0.2
/100
|
#273
Tragic
51.9%
Africans
0.2
/100
|
#274
Tragic
51.8%
Immigrants | Honduras
0.2
/100
|
#275
Tragic
51.8%