Taiwanese vs Cree 2 or more Vehicles in Household
COMPARE
Taiwanese
Cree
2 or more Vehicles in Household
2 or more Vehicles in Household Comparison
Taiwanese
Cree
53.9%
2 OR MORE VEHICLES IN HOUSEHOLD
6.3/ 100
METRIC RATING
220th/ 347
METRIC RANK
55.1%
2 OR MORE VEHICLES IN HOUSEHOLD
38.2/ 100
METRIC RATING
182nd/ 347
METRIC RANK
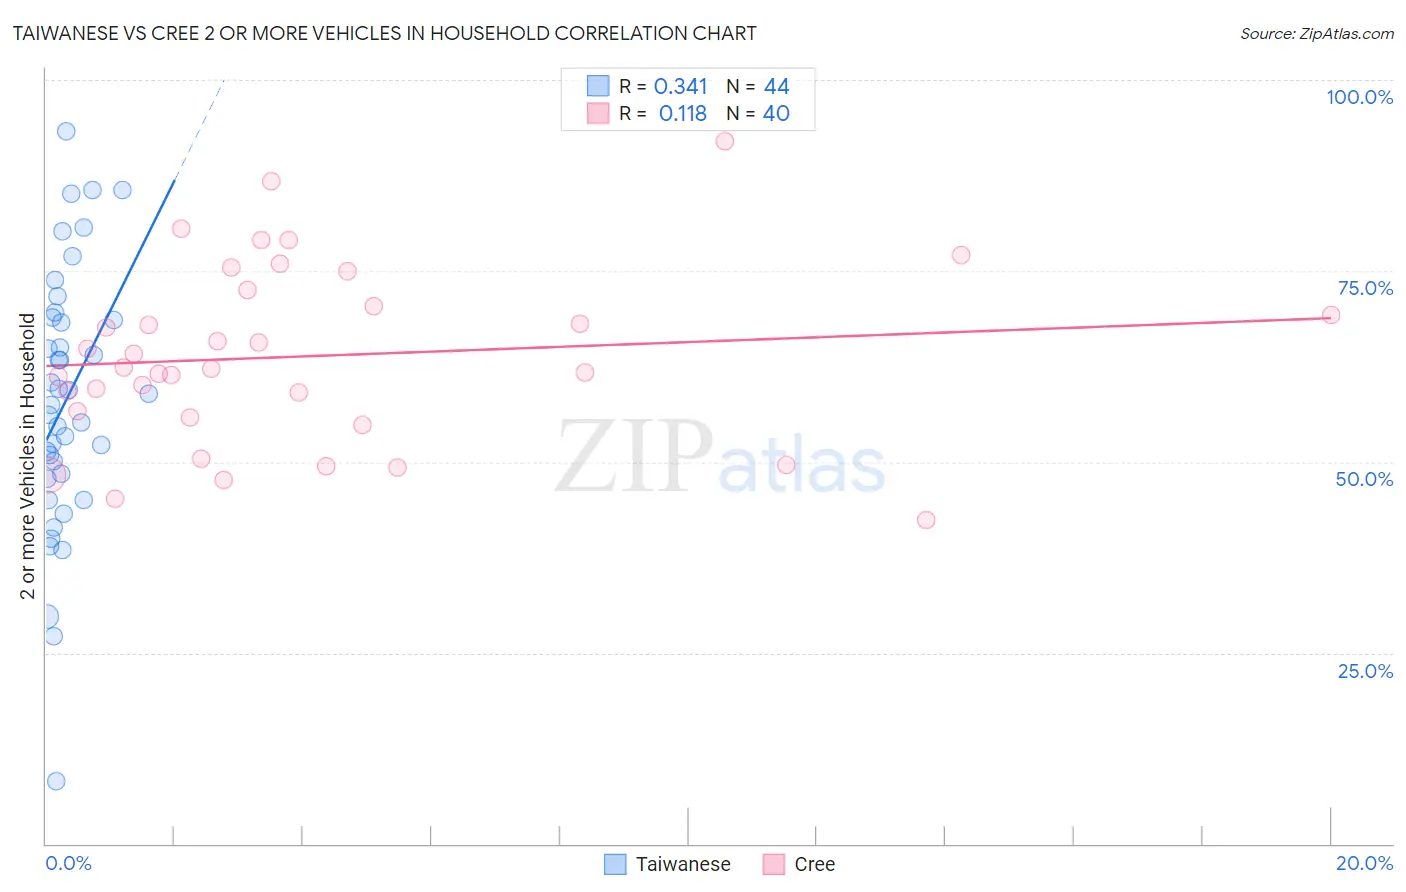
Taiwanese vs Cree 2 or more Vehicles in Household Correlation Chart
The statistical analysis conducted on geographies consisting of 31,715,954 people shows a mild positive correlation between the proportion of Taiwanese and percentage of households with 2 or more vehicles available in the United States with a correlation coefficient (R) of 0.341 and weighted average of 53.9%. Similarly, the statistical analysis conducted on geographies consisting of 76,210,632 people shows a poor positive correlation between the proportion of Cree and percentage of households with 2 or more vehicles available in the United States with a correlation coefficient (R) of 0.118 and weighted average of 55.1%, a difference of 2.3%.
2 or more Vehicles in Household Correlation Summary
| Measurement | Taiwanese | Cree |
| Minimum | 8.2% | 42.4% |
| Maximum | 93.3% | 91.9% |
| Range | 85.2% | 49.6% |
| Mean | 58.0% | 63.9% |
| Median | 58.2% | 62.3% |
| Interquartile 25% (IQ1) | 48.1% | 56.2% |
| Interquartile 75% (IQ3) | 68.8% | 71.4% |
| Interquartile Range (IQR) | 20.6% | 15.2% |
| Standard Deviation (Sample) | 17.1% | 11.6% |
| Standard Deviation (Population) | 16.9% | 11.5% |
Similar Demographics by 2 or more Vehicles in Household
Demographics Similar to Taiwanese by 2 or more Vehicles in Household
In terms of 2 or more vehicles in household, the demographic groups most similar to Taiwanese are Immigrants from Singapore (53.9%, a difference of 0.010%), South American Indian (53.9%, a difference of 0.020%), Kiowa (53.9%, a difference of 0.030%), Immigrants from Argentina (53.9%, a difference of 0.080%), and Immigrants from Burma/Myanmar (53.9%, a difference of 0.13%).
| Demographics | Rating | Rank | 2 or more Vehicles in Household |
| Guatemalans | 9.6 /100 | #213 | Tragic 54.1% |
| Immigrants | Czechoslovakia | 9.4 /100 | #214 | Tragic 54.1% |
| Aleuts | 9.3 /100 | #215 | Tragic 54.1% |
| Immigrants | Western Asia | 9.3 /100 | #216 | Tragic 54.1% |
| Immigrants | Burma/Myanmar | 7.1 /100 | #217 | Tragic 53.9% |
| Immigrants | Argentina | 6.8 /100 | #218 | Tragic 53.9% |
| South American Indians | 6.5 /100 | #219 | Tragic 53.9% |
| Taiwanese | 6.3 /100 | #220 | Tragic 53.9% |
| Immigrants | Singapore | 6.3 /100 | #221 | Tragic 53.9% |
| Kiowa | 6.2 /100 | #222 | Tragic 53.9% |
| Immigrants | Bosnia and Herzegovina | 5.5 /100 | #223 | Tragic 53.8% |
| Brazilians | 5.3 /100 | #224 | Tragic 53.8% |
| Immigrants | Egypt | 5.2 /100 | #225 | Tragic 53.8% |
| Immigrants | Eastern Africa | 5.1 /100 | #226 | Tragic 53.7% |
| Sudanese | 4.1 /100 | #227 | Tragic 53.6% |
Demographics Similar to Cree by 2 or more Vehicles in Household
In terms of 2 or more vehicles in household, the demographic groups most similar to Cree are Immigrants from Micronesia (55.1%, a difference of 0.0%), Immigrants from Cameroon (55.1%, a difference of 0.040%), Apache (55.1%, a difference of 0.060%), Immigrants from Kenya (55.1%, a difference of 0.090%), and Arab (55.0%, a difference of 0.10%).
| Demographics | Rating | Rank | 2 or more Vehicles in Household |
| Immigrants | Denmark | 49.4 /100 | #175 | Average 55.3% |
| Immigrants | Cuba | 47.0 /100 | #176 | Average 55.3% |
| Menominee | 46.2 /100 | #177 | Average 55.3% |
| Immigrants | Sweden | 45.3 /100 | #178 | Average 55.2% |
| Alaskan Athabascans | 42.9 /100 | #179 | Average 55.2% |
| Immigrants | Kenya | 40.4 /100 | #180 | Average 55.1% |
| Immigrants | Micronesia | 38.2 /100 | #181 | Fair 55.1% |
| Cree | 38.2 /100 | #182 | Fair 55.1% |
| Immigrants | Cameroon | 37.3 /100 | #183 | Fair 55.1% |
| Apache | 36.7 /100 | #184 | Fair 55.1% |
| Arabs | 35.9 /100 | #185 | Fair 55.0% |
| Peruvians | 33.7 /100 | #186 | Fair 55.0% |
| Immigrants | Uganda | 33.4 /100 | #187 | Fair 55.0% |
| Marshallese | 30.5 /100 | #188 | Fair 54.9% |
| Eastern Europeans | 27.5 /100 | #189 | Fair 54.8% |