Taiwanese vs Soviet Union 2 or more Vehicles in Household
COMPARE
Taiwanese
Soviet Union
2 or more Vehicles in Household
2 or more Vehicles in Household Comparison
Taiwanese
Soviet Union
53.9%
2 OR MORE VEHICLES IN HOUSEHOLD
6.3/ 100
METRIC RATING
220th/ 347
METRIC RANK
45.7%
2 OR MORE VEHICLES IN HOUSEHOLD
0.0/ 100
METRIC RATING
320th/ 347
METRIC RANK
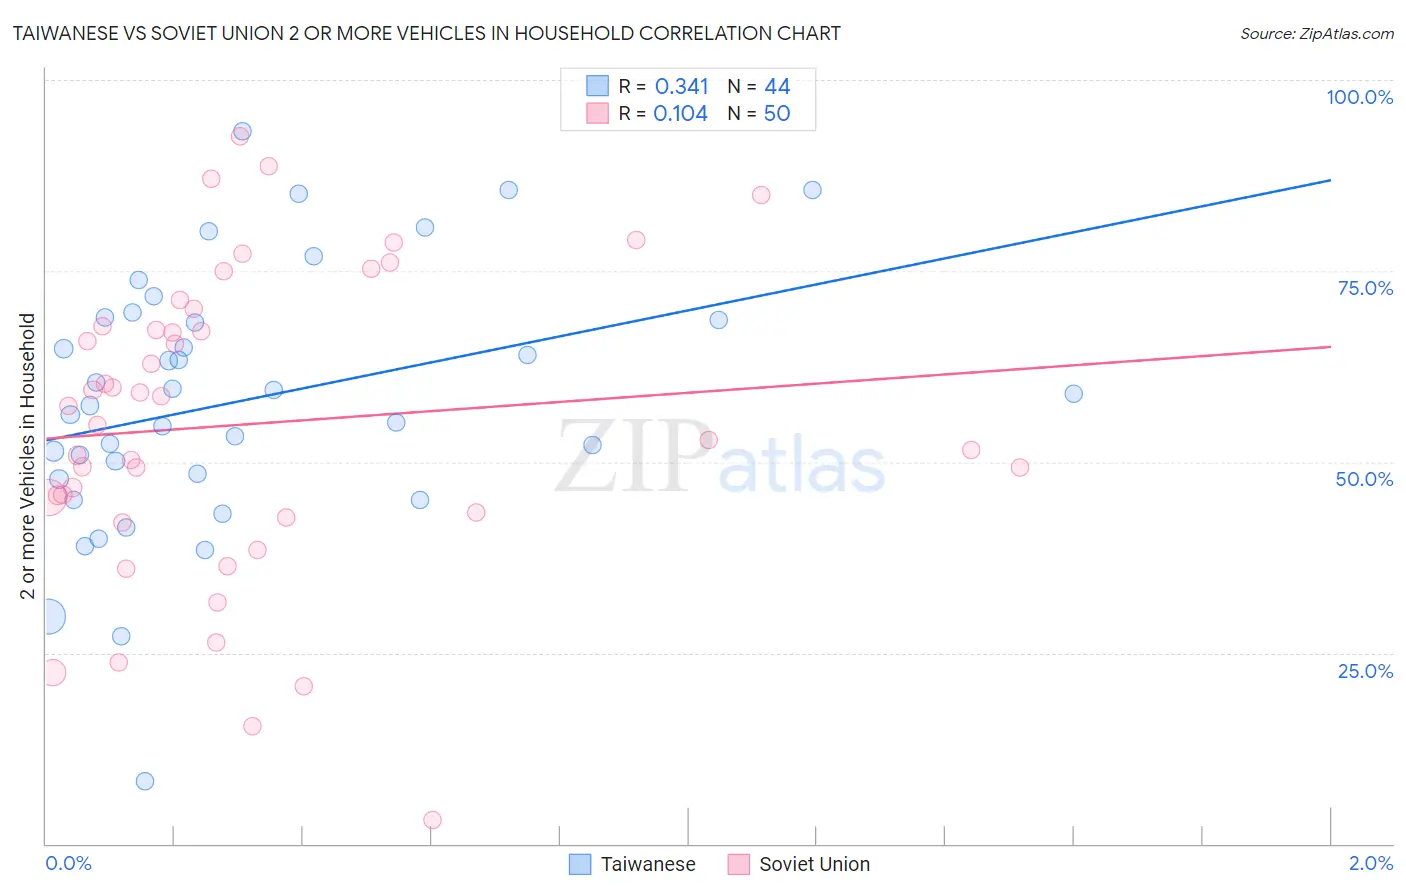
Taiwanese vs Soviet Union 2 or more Vehicles in Household Correlation Chart
The statistical analysis conducted on geographies consisting of 31,715,954 people shows a mild positive correlation between the proportion of Taiwanese and percentage of households with 2 or more vehicles available in the United States with a correlation coefficient (R) of 0.341 and weighted average of 53.9%. Similarly, the statistical analysis conducted on geographies consisting of 43,509,630 people shows a poor positive correlation between the proportion of Soviet Union and percentage of households with 2 or more vehicles available in the United States with a correlation coefficient (R) of 0.104 and weighted average of 45.7%, a difference of 17.8%.
2 or more Vehicles in Household Correlation Summary
| Measurement | Taiwanese | Soviet Union |
| Minimum | 8.2% | 3.0% |
| Maximum | 93.3% | 92.6% |
| Range | 85.2% | 89.6% |
| Mean | 58.0% | 54.9% |
| Median | 58.2% | 56.1% |
| Interquartile 25% (IQ1) | 48.1% | 43.4% |
| Interquartile 75% (IQ3) | 68.8% | 67.8% |
| Interquartile Range (IQR) | 20.6% | 24.4% |
| Standard Deviation (Sample) | 17.1% | 20.0% |
| Standard Deviation (Population) | 16.9% | 19.8% |
Similar Demographics by 2 or more Vehicles in Household
Demographics Similar to Taiwanese by 2 or more Vehicles in Household
In terms of 2 or more vehicles in household, the demographic groups most similar to Taiwanese are Immigrants from Singapore (53.9%, a difference of 0.010%), South American Indian (53.9%, a difference of 0.020%), Kiowa (53.9%, a difference of 0.030%), Immigrants from Argentina (53.9%, a difference of 0.080%), and Immigrants from Burma/Myanmar (53.9%, a difference of 0.13%).
| Demographics | Rating | Rank | 2 or more Vehicles in Household |
| Guatemalans | 9.6 /100 | #213 | Tragic 54.1% |
| Immigrants | Czechoslovakia | 9.4 /100 | #214 | Tragic 54.1% |
| Aleuts | 9.3 /100 | #215 | Tragic 54.1% |
| Immigrants | Western Asia | 9.3 /100 | #216 | Tragic 54.1% |
| Immigrants | Burma/Myanmar | 7.1 /100 | #217 | Tragic 53.9% |
| Immigrants | Argentina | 6.8 /100 | #218 | Tragic 53.9% |
| South American Indians | 6.5 /100 | #219 | Tragic 53.9% |
| Taiwanese | 6.3 /100 | #220 | Tragic 53.9% |
| Immigrants | Singapore | 6.3 /100 | #221 | Tragic 53.9% |
| Kiowa | 6.2 /100 | #222 | Tragic 53.9% |
| Immigrants | Bosnia and Herzegovina | 5.5 /100 | #223 | Tragic 53.8% |
| Brazilians | 5.3 /100 | #224 | Tragic 53.8% |
| Immigrants | Egypt | 5.2 /100 | #225 | Tragic 53.8% |
| Immigrants | Eastern Africa | 5.1 /100 | #226 | Tragic 53.7% |
| Sudanese | 4.1 /100 | #227 | Tragic 53.6% |
Demographics Similar to Soviet Union by 2 or more Vehicles in Household
In terms of 2 or more vehicles in household, the demographic groups most similar to Soviet Union are Jamaican (45.8%, a difference of 0.060%), Immigrants from Albania (46.0%, a difference of 0.58%), Immigrants from Haiti (46.5%, a difference of 1.7%), Cape Verdean (46.8%, a difference of 2.3%), and Immigrants from Jamaica (44.5%, a difference of 2.9%).
| Demographics | Rating | Rank | 2 or more Vehicles in Household |
| U.S. Virgin Islanders | 0.0 /100 | #313 | Tragic 47.5% |
| Immigrants | Ghana | 0.0 /100 | #314 | Tragic 47.4% |
| Puerto Ricans | 0.0 /100 | #315 | Tragic 47.1% |
| Cape Verdeans | 0.0 /100 | #316 | Tragic 46.8% |
| Immigrants | Haiti | 0.0 /100 | #317 | Tragic 46.5% |
| Immigrants | Albania | 0.0 /100 | #318 | Tragic 46.0% |
| Jamaicans | 0.0 /100 | #319 | Tragic 45.8% |
| Soviet Union | 0.0 /100 | #320 | Tragic 45.7% |
| Immigrants | Jamaica | 0.0 /100 | #321 | Tragic 44.5% |
| Senegalese | 0.0 /100 | #322 | Tragic 44.2% |
| Immigrants | Caribbean | 0.0 /100 | #323 | Tragic 44.2% |
| Immigrants | Cabo Verde | 0.0 /100 | #324 | Tragic 43.3% |
| Immigrants | West Indies | 0.0 /100 | #325 | Tragic 43.1% |
| Immigrants | Senegal | 0.0 /100 | #326 | Tragic 43.0% |
| Immigrants | Yemen | 0.0 /100 | #327 | Tragic 42.8% |