Immigrants from Pakistan vs Pima 2 or more Vehicles in Household
COMPARE
Immigrants from Pakistan
Pima
2 or more Vehicles in Household
2 or more Vehicles in Household Comparison
Immigrants from Pakistan
Pima
56.1%
2 OR MORE VEHICLES IN HOUSEHOLD
78.1/ 100
METRIC RATING
152nd/ 347
METRIC RANK
52.0%
2 OR MORE VEHICLES IN HOUSEHOLD
0.2/ 100
METRIC RATING
268th/ 347
METRIC RANK
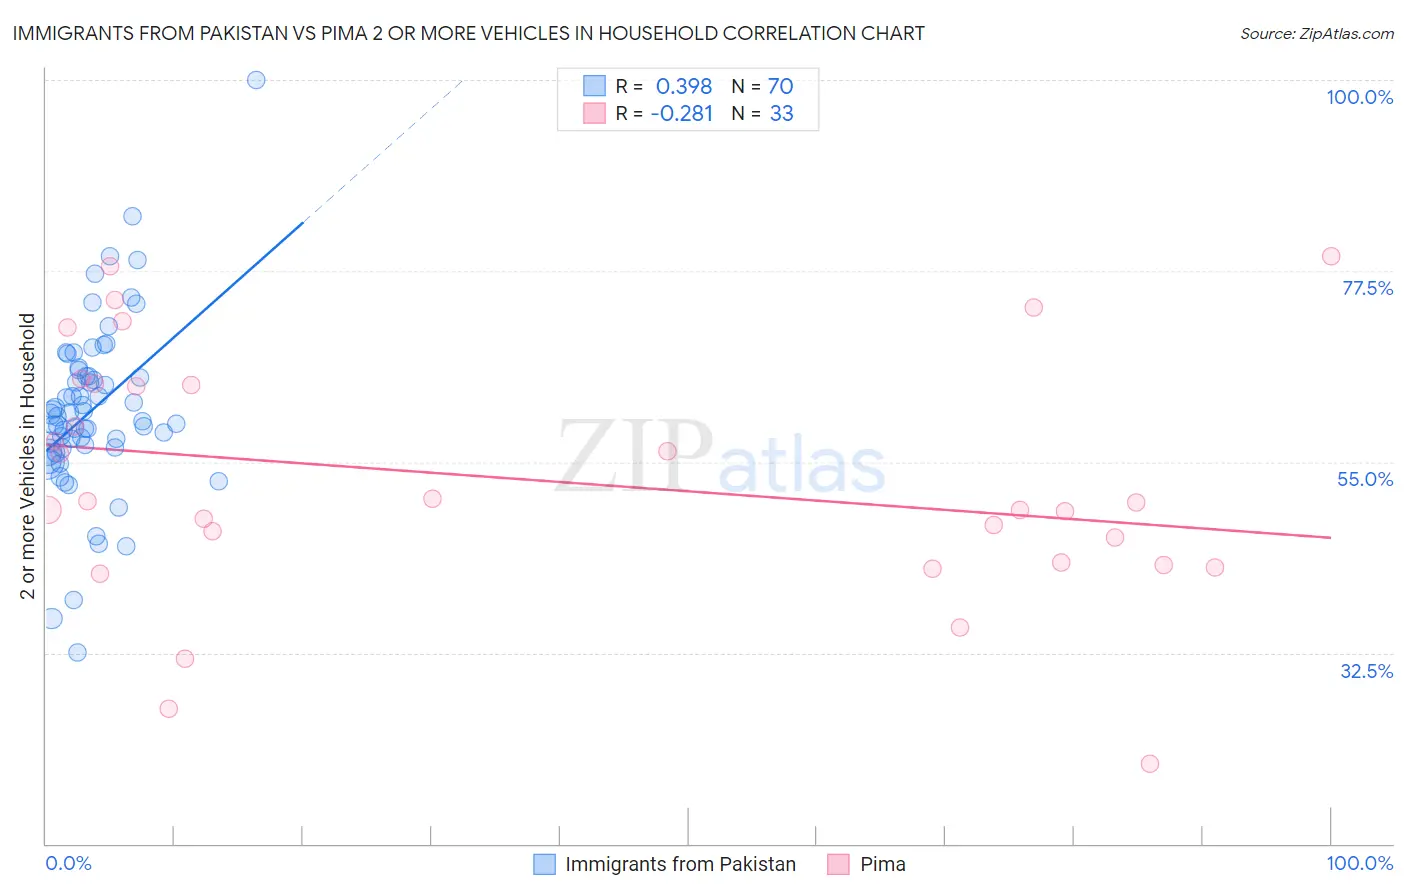
Immigrants from Pakistan vs Pima 2 or more Vehicles in Household Correlation Chart
The statistical analysis conducted on geographies consisting of 283,700,045 people shows a mild positive correlation between the proportion of Immigrants from Pakistan and percentage of households with 2 or more vehicles available in the United States with a correlation coefficient (R) of 0.398 and weighted average of 56.1%. Similarly, the statistical analysis conducted on geographies consisting of 61,539,452 people shows a weak negative correlation between the proportion of Pima and percentage of households with 2 or more vehicles available in the United States with a correlation coefficient (R) of -0.281 and weighted average of 52.0%, a difference of 7.8%.
2 or more Vehicles in Household Correlation Summary
| Measurement | Immigrants from Pakistan | Pima |
| Minimum | 32.5% | 19.4% |
| Maximum | 100.0% | 79.2% |
| Range | 67.5% | 59.9% |
| Mean | 61.1% | 52.9% |
| Median | 60.5% | 50.2% |
| Interquartile 25% (IQ1) | 56.7% | 43.0% |
| Interquartile 75% (IQ3) | 65.2% | 64.1% |
| Interquartile Range (IQR) | 8.5% | 21.1% |
| Standard Deviation (Sample) | 10.3% | 14.6% |
| Standard Deviation (Population) | 10.3% | 14.3% |
Similar Demographics by 2 or more Vehicles in Household
Demographics Similar to Immigrants from Pakistan by 2 or more Vehicles in Household
In terms of 2 or more vehicles in household, the demographic groups most similar to Immigrants from Pakistan are Immigrants from Northern Europe (56.1%, a difference of 0.030%), Nicaraguan (56.1%, a difference of 0.10%), Immigrants from Moldova (56.1%, a difference of 0.12%), Chilean (56.1%, a difference of 0.12%), and Serbian (56.1%, a difference of 0.13%).
| Demographics | Rating | Rank | 2 or more Vehicles in Household |
| Syrians | 81.2 /100 | #145 | Excellent 56.2% |
| Venezuelans | 80.7 /100 | #146 | Excellent 56.1% |
| Serbians | 80.3 /100 | #147 | Excellent 56.1% |
| Immigrants | Moldova | 80.2 /100 | #148 | Excellent 56.1% |
| Chileans | 80.2 /100 | #149 | Excellent 56.1% |
| Nicaraguans | 79.9 /100 | #150 | Good 56.1% |
| Immigrants | Northern Europe | 78.7 /100 | #151 | Good 56.1% |
| Immigrants | Pakistan | 78.1 /100 | #152 | Good 56.1% |
| Lumbee | 71.9 /100 | #153 | Good 55.9% |
| Ukrainians | 70.8 /100 | #154 | Good 55.8% |
| Immigrants | Venezuela | 70.7 /100 | #155 | Good 55.8% |
| Immigrants | Lithuania | 70.4 /100 | #156 | Good 55.8% |
| Immigrants | Kuwait | 70.2 /100 | #157 | Good 55.8% |
| Tlingit-Haida | 68.5 /100 | #158 | Good 55.8% |
| Paiute | 68.0 /100 | #159 | Good 55.8% |
Demographics Similar to Pima by 2 or more Vehicles in Household
In terms of 2 or more vehicles in household, the demographic groups most similar to Pima are Immigrants from Colombia (52.0%, a difference of 0.010%), Honduran (52.0%, a difference of 0.010%), Immigrants from Ireland (52.0%, a difference of 0.030%), Immigrants from France (52.0%, a difference of 0.060%), and Immigrants from Congo (52.1%, a difference of 0.20%).
| Demographics | Rating | Rank | 2 or more Vehicles in Household |
| Immigrants | Australia | 0.5 /100 | #261 | Tragic 52.4% |
| Immigrants | Northern Africa | 0.4 /100 | #262 | Tragic 52.3% |
| Immigrants | Southern Europe | 0.4 /100 | #263 | Tragic 52.3% |
| Immigrants | Latvia | 0.4 /100 | #264 | Tragic 52.2% |
| Immigrants | Congo | 0.3 /100 | #265 | Tragic 52.1% |
| Immigrants | France | 0.2 /100 | #266 | Tragic 52.0% |
| Immigrants | Colombia | 0.2 /100 | #267 | Tragic 52.0% |
| Pima | 0.2 /100 | #268 | Tragic 52.0% |
| Hondurans | 0.2 /100 | #269 | Tragic 52.0% |
| Immigrants | Ireland | 0.2 /100 | #270 | Tragic 52.0% |
| South Americans | 0.2 /100 | #271 | Tragic 51.9% |
| Sub-Saharan Africans | 0.2 /100 | #272 | Tragic 51.9% |
| Israelis | 0.2 /100 | #273 | Tragic 51.9% |
| Africans | 0.2 /100 | #274 | Tragic 51.8% |
| Immigrants | Honduras | 0.2 /100 | #275 | Tragic 51.8% |