Taiwanese vs Pima Single Mother Households
COMPARE
Taiwanese
Pima
Single Mother Households
Single Mother Households Comparison
Taiwanese
Pima
5.8%
SINGLE MOTHER HOUSEHOLDS
96.1/ 100
METRIC RATING
105th/ 347
METRIC RANK
8.3%
SINGLE MOTHER HOUSEHOLDS
0.0/ 100
METRIC RATING
322nd/ 347
METRIC RANK
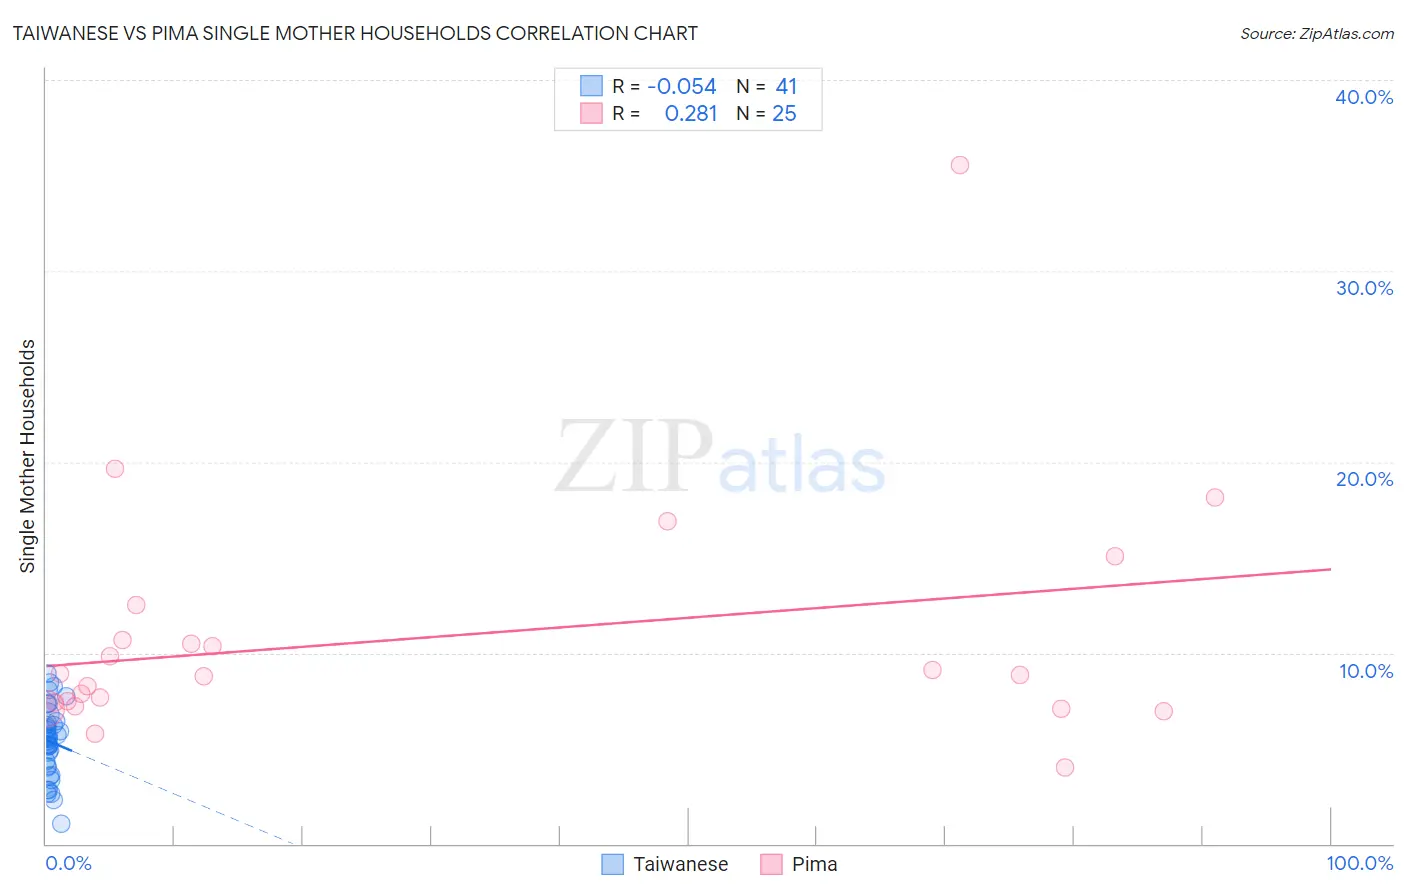
Taiwanese vs Pima Single Mother Households Correlation Chart
The statistical analysis conducted on geographies consisting of 31,687,013 people shows a slight negative correlation between the proportion of Taiwanese and percentage of single mother households in the United States with a correlation coefficient (R) of -0.054 and weighted average of 5.8%. Similarly, the statistical analysis conducted on geographies consisting of 61,448,407 people shows a weak positive correlation between the proportion of Pima and percentage of single mother households in the United States with a correlation coefficient (R) of 0.281 and weighted average of 8.3%, a difference of 43.8%.
Single Mother Households Correlation Summary
| Measurement | Taiwanese | Pima |
| Minimum | 1.1% | 4.0% |
| Maximum | 8.9% | 35.5% |
| Range | 7.8% | 31.6% |
| Mean | 5.3% | 10.9% |
| Median | 5.5% | 8.8% |
| Interquartile 25% (IQ1) | 4.0% | 7.3% |
| Interquartile 75% (IQ3) | 6.4% | 11.6% |
| Interquartile Range (IQR) | 2.4% | 4.3% |
| Standard Deviation (Sample) | 1.8% | 6.4% |
| Standard Deviation (Population) | 1.8% | 6.3% |
Similar Demographics by Single Mother Households
Demographics Similar to Taiwanese by Single Mother Households
In terms of single mother households, the demographic groups most similar to Taiwanese are Northern European (5.8%, a difference of 0.070%), Scottish (5.8%, a difference of 0.080%), German (5.8%, a difference of 0.10%), English (5.8%, a difference of 0.10%), and Immigrants from Ukraine (5.8%, a difference of 0.10%).
| Demographics | Rating | Rank | Single Mother Households |
| Immigrants | South Africa | 96.3 /100 | #98 | Exceptional 5.7% |
| Immigrants | Poland | 96.3 /100 | #99 | Exceptional 5.8% |
| Scandinavians | 96.2 /100 | #100 | Exceptional 5.8% |
| Germans | 96.2 /100 | #101 | Exceptional 5.8% |
| English | 96.2 /100 | #102 | Exceptional 5.8% |
| Scottish | 96.2 /100 | #103 | Exceptional 5.8% |
| Northern Europeans | 96.2 /100 | #104 | Exceptional 5.8% |
| Taiwanese | 96.1 /100 | #105 | Exceptional 5.8% |
| Immigrants | Ukraine | 95.9 /100 | #106 | Exceptional 5.8% |
| Paraguayans | 95.8 /100 | #107 | Exceptional 5.8% |
| Immigrants | Italy | 95.8 /100 | #108 | Exceptional 5.8% |
| Immigrants | Western Europe | 95.7 /100 | #109 | Exceptional 5.8% |
| British | 95.5 /100 | #110 | Exceptional 5.8% |
| Immigrants | England | 95.5 /100 | #111 | Exceptional 5.8% |
| Immigrants | Kuwait | 95.4 /100 | #112 | Exceptional 5.8% |
Demographics Similar to Pima by Single Mother Households
In terms of single mother households, the demographic groups most similar to Pima are Immigrants from Senegal (8.3%, a difference of 0.080%), Bahamian (8.3%, a difference of 0.32%), Jamaican (8.2%, a difference of 0.44%), Haitian (8.3%, a difference of 0.53%), and Senegalese (8.2%, a difference of 0.55%).
| Demographics | Rating | Rank | Single Mother Households |
| Immigrants | Western Africa | 0.0 /100 | #315 | Tragic 8.2% |
| Africans | 0.0 /100 | #316 | Tragic 8.2% |
| Immigrants | Honduras | 0.0 /100 | #317 | Tragic 8.2% |
| Senegalese | 0.0 /100 | #318 | Tragic 8.2% |
| Jamaicans | 0.0 /100 | #319 | Tragic 8.2% |
| Bahamians | 0.0 /100 | #320 | Tragic 8.3% |
| Immigrants | Senegal | 0.0 /100 | #321 | Tragic 8.3% |
| Pima | 0.0 /100 | #322 | Tragic 8.3% |
| Haitians | 0.0 /100 | #323 | Tragic 8.3% |
| Immigrants | Jamaica | 0.0 /100 | #324 | Tragic 8.4% |
| Immigrants | Caribbean | 0.0 /100 | #325 | Tragic 8.4% |
| British West Indians | 0.0 /100 | #326 | Tragic 8.4% |
| Immigrants | Haiti | 0.0 /100 | #327 | Tragic 8.4% |
| Yakama | 0.0 /100 | #328 | Tragic 8.4% |
| Hopi | 0.0 /100 | #329 | Tragic 8.5% |