Swedish vs Apache Female Disability
COMPARE
Swedish
Apache
Female Disability
Female Disability Comparison
Swedes
Apache
12.3%
FEMALE DISABILITY
26.6/ 100
METRIC RATING
195th/ 347
METRIC RANK
13.7%
FEMALE DISABILITY
0.0/ 100
METRIC RATING
310th/ 347
METRIC RANK
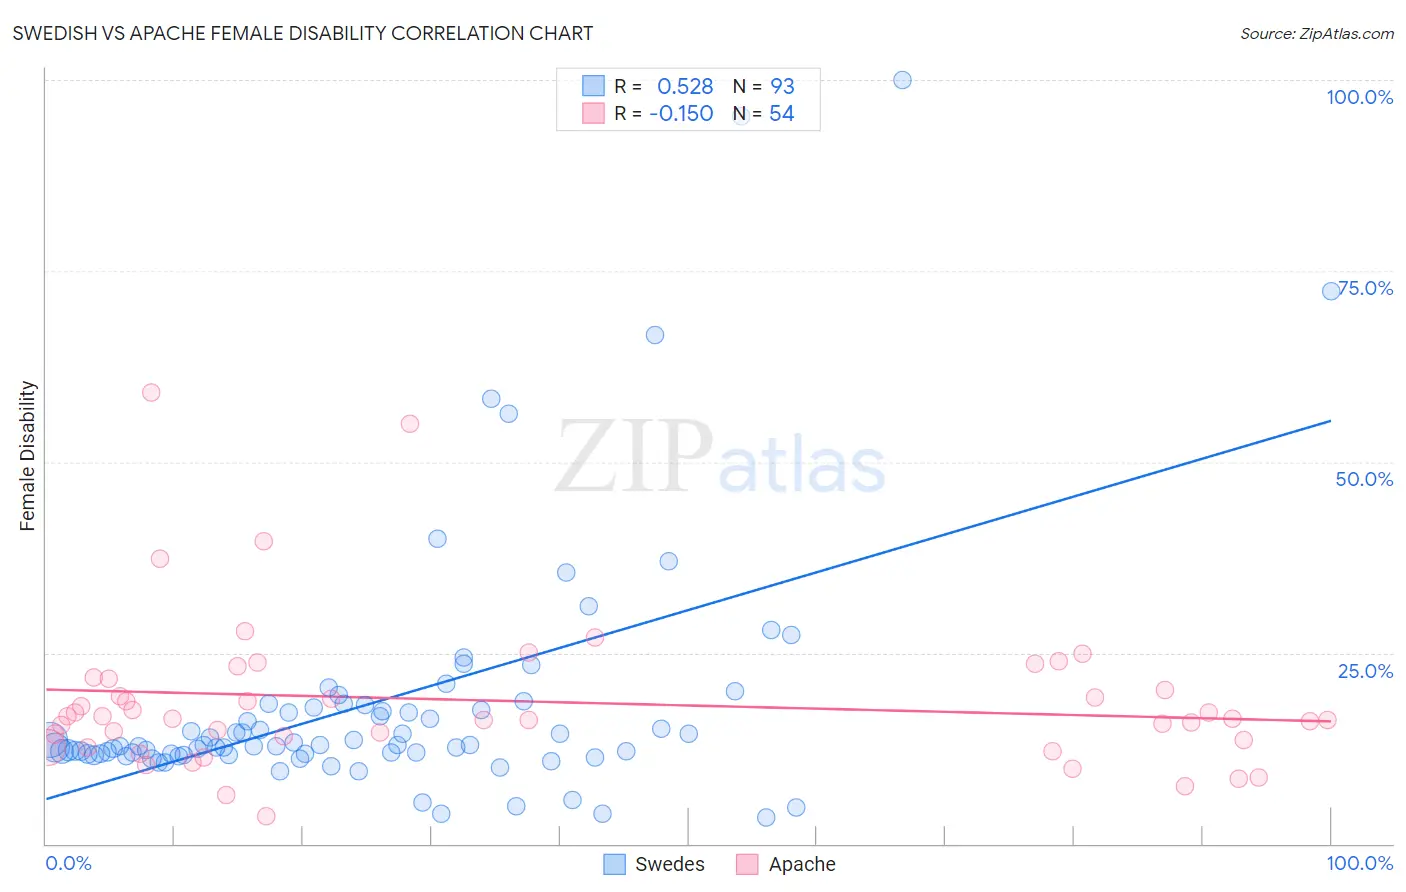
Swedish vs Apache Female Disability Correlation Chart
The statistical analysis conducted on geographies consisting of 539,030,282 people shows a substantial positive correlation between the proportion of Swedes and percentage of females with a disability in the United States with a correlation coefficient (R) of 0.528 and weighted average of 12.3%. Similarly, the statistical analysis conducted on geographies consisting of 231,061,138 people shows a poor negative correlation between the proportion of Apache and percentage of females with a disability in the United States with a correlation coefficient (R) of -0.150 and weighted average of 13.7%, a difference of 11.3%.
Female Disability Correlation Summary
| Measurement | Swedish | Apache |
| Minimum | 3.5% | 3.6% |
| Maximum | 100.0% | 59.0% |
| Range | 96.5% | 55.5% |
| Mean | 18.5% | 18.7% |
| Median | 12.9% | 16.3% |
| Interquartile 25% (IQ1) | 11.7% | 13.7% |
| Interquartile 75% (IQ3) | 18.0% | 21.6% |
| Interquartile Range (IQR) | 6.3% | 7.9% |
| Standard Deviation (Sample) | 16.8% | 10.1% |
| Standard Deviation (Population) | 16.7% | 10.0% |
Similar Demographics by Female Disability
Demographics Similar to Swedes by Female Disability
In terms of female disability, the demographic groups most similar to Swedes are Ukrainian (12.3%, a difference of 0.030%), Northern European (12.3%, a difference of 0.040%), Immigrants from Panama (12.3%, a difference of 0.060%), Honduran (12.3%, a difference of 0.060%), and Mexican American Indian (12.3%, a difference of 0.080%).
| Demographics | Rating | Rank | Female Disability |
| Immigrants | North America | 32.8 /100 | #188 | Fair 12.3% |
| Immigrants | Albania | 31.6 /100 | #189 | Fair 12.3% |
| Immigrants | Honduras | 31.3 /100 | #190 | Fair 12.3% |
| Armenians | 29.7 /100 | #191 | Fair 12.3% |
| Immigrants | Western Africa | 29.2 /100 | #192 | Fair 12.3% |
| Northern Europeans | 27.5 /100 | #193 | Fair 12.3% |
| Ukrainians | 27.2 /100 | #194 | Fair 12.3% |
| Swedes | 26.6 /100 | #195 | Fair 12.3% |
| Immigrants | Panama | 25.5 /100 | #196 | Fair 12.3% |
| Hondurans | 25.4 /100 | #197 | Fair 12.3% |
| Mexican American Indians | 24.9 /100 | #198 | Fair 12.3% |
| Immigrants | Trinidad and Tobago | 24.7 /100 | #199 | Fair 12.3% |
| Trinidadians and Tobagonians | 22.4 /100 | #200 | Fair 12.3% |
| Chinese | 22.1 /100 | #201 | Fair 12.3% |
| Somalis | 21.5 /100 | #202 | Fair 12.3% |
Demographics Similar to Apache by Female Disability
In terms of female disability, the demographic groups most similar to Apache are French American Indian (13.7%, a difference of 0.12%), Cree (13.7%, a difference of 0.18%), Hopi (13.7%, a difference of 0.29%), Delaware (13.8%, a difference of 0.60%), and Central American Indian (13.6%, a difference of 0.63%).
| Demographics | Rating | Rank | Female Disability |
| Immigrants | Portugal | 0.0 /100 | #303 | Tragic 13.5% |
| Immigrants | Micronesia | 0.0 /100 | #304 | Tragic 13.5% |
| Dominicans | 0.0 /100 | #305 | Tragic 13.5% |
| French Canadians | 0.0 /100 | #306 | Tragic 13.6% |
| Central American Indians | 0.0 /100 | #307 | Tragic 13.6% |
| Cree | 0.0 /100 | #308 | Tragic 13.7% |
| French American Indians | 0.0 /100 | #309 | Tragic 13.7% |
| Apache | 0.0 /100 | #310 | Tragic 13.7% |
| Hopi | 0.0 /100 | #311 | Tragic 13.7% |
| Delaware | 0.0 /100 | #312 | Tragic 13.8% |
| Blackfeet | 0.0 /100 | #313 | Tragic 13.8% |
| Puget Sound Salish | 0.0 /100 | #314 | Tragic 13.8% |
| Alaskan Athabascans | 0.0 /100 | #315 | Tragic 13.9% |
| Spanish Americans | 0.0 /100 | #316 | Tragic 14.0% |
| Chippewa | 0.0 /100 | #317 | Tragic 14.0% |