Spaniard vs Immigrants from North Macedonia 2 or more Vehicles in Household
COMPARE
Spaniard
Immigrants from North Macedonia
2 or more Vehicles in Household
2 or more Vehicles in Household Comparison
Spaniards
Immigrants from North Macedonia
59.2%
2 OR MORE VEHICLES IN HOUSEHOLD
99.9/ 100
METRIC RATING
51st/ 347
METRIC RANK
54.4%
2 OR MORE VEHICLES IN HOUSEHOLD
14.9/ 100
METRIC RATING
202nd/ 347
METRIC RANK
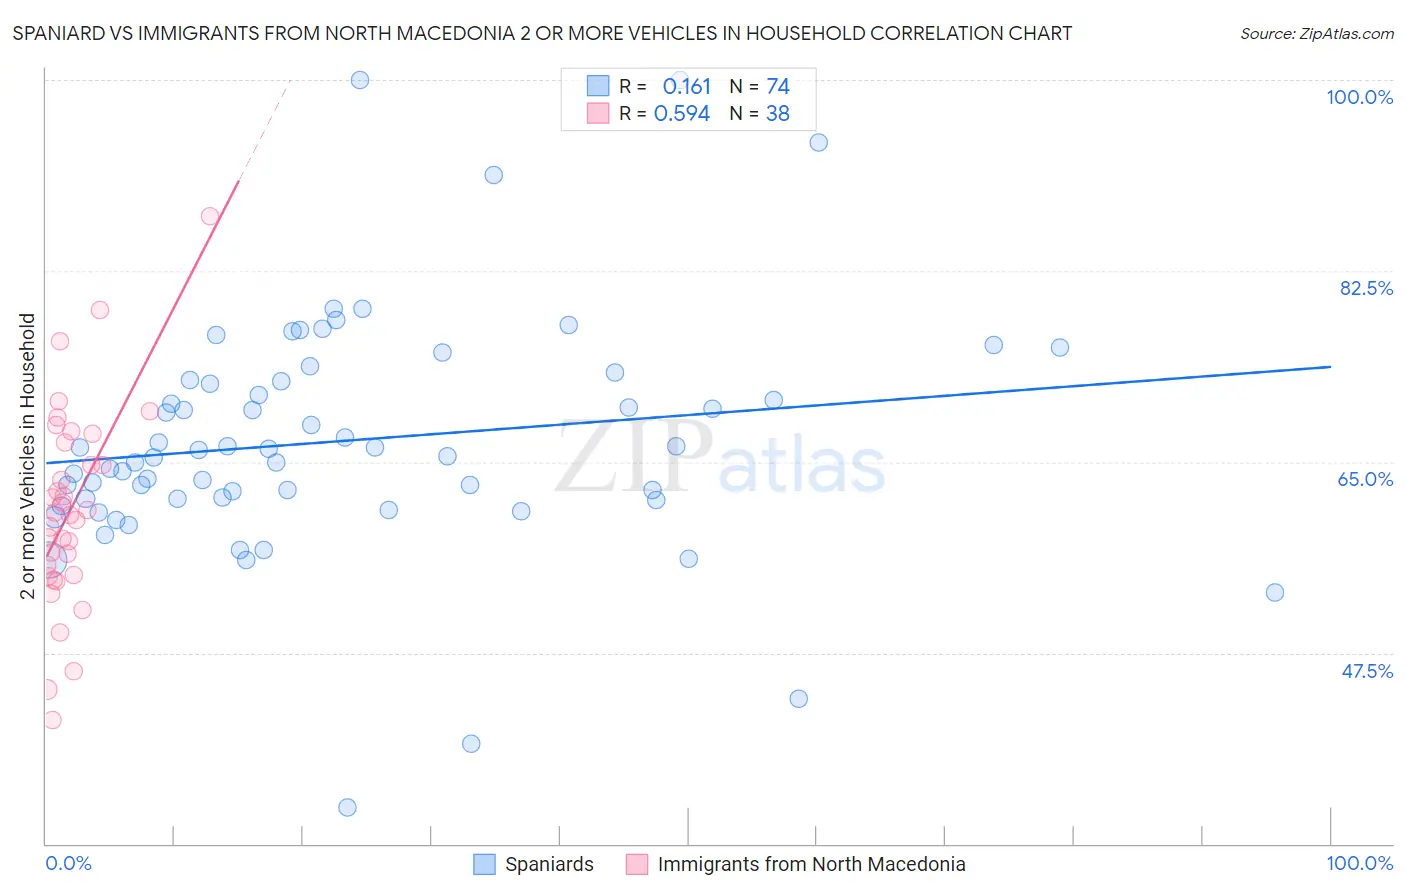
Spaniard vs Immigrants from North Macedonia 2 or more Vehicles in Household Correlation Chart
The statistical analysis conducted on geographies consisting of 443,212,223 people shows a poor positive correlation between the proportion of Spaniards and percentage of households with 2 or more vehicles available in the United States with a correlation coefficient (R) of 0.161 and weighted average of 59.2%. Similarly, the statistical analysis conducted on geographies consisting of 74,306,697 people shows a substantial positive correlation between the proportion of Immigrants from North Macedonia and percentage of households with 2 or more vehicles available in the United States with a correlation coefficient (R) of 0.594 and weighted average of 54.4%, a difference of 8.8%.
2 or more Vehicles in Household Correlation Summary
| Measurement | Spaniard | Immigrants from North Macedonia |
| Minimum | 33.3% | 41.4% |
| Maximum | 100.0% | 87.5% |
| Range | 66.7% | 46.1% |
| Mean | 66.9% | 60.7% |
| Median | 65.8% | 60.2% |
| Interquartile 25% (IQ1) | 61.6% | 54.6% |
| Interquartile 75% (IQ3) | 72.4% | 66.8% |
| Interquartile Range (IQR) | 10.9% | 12.2% |
| Standard Deviation (Sample) | 11.0% | 9.3% |
| Standard Deviation (Population) | 10.9% | 9.1% |
Similar Demographics by 2 or more Vehicles in Household
Demographics Similar to Spaniards by 2 or more Vehicles in Household
In terms of 2 or more vehicles in household, the demographic groups most similar to Spaniards are Immigrants from Laos (59.2%, a difference of 0.0%), Celtic (59.2%, a difference of 0.020%), Choctaw (59.3%, a difference of 0.14%), Belgian (59.3%, a difference of 0.15%), and Bhutanese (59.1%, a difference of 0.16%).
| Demographics | Rating | Rank | 2 or more Vehicles in Household |
| French | 100.0 /100 | #44 | Exceptional 59.8% |
| Immigrants | Taiwan | 100.0 /100 | #45 | Exceptional 59.7% |
| Immigrants | South Eastern Asia | 100.0 /100 | #46 | Exceptional 59.6% |
| Yaqui | 99.9 /100 | #47 | Exceptional 59.3% |
| Immigrants | India | 99.9 /100 | #48 | Exceptional 59.3% |
| Belgians | 99.9 /100 | #49 | Exceptional 59.3% |
| Choctaw | 99.9 /100 | #50 | Exceptional 59.3% |
| Spaniards | 99.9 /100 | #51 | Exceptional 59.2% |
| Immigrants | Laos | 99.9 /100 | #52 | Exceptional 59.2% |
| Celtics | 99.9 /100 | #53 | Exceptional 59.2% |
| Bhutanese | 99.9 /100 | #54 | Exceptional 59.1% |
| Luxembourgers | 99.9 /100 | #55 | Exceptional 59.1% |
| Chickasaw | 99.9 /100 | #56 | Exceptional 59.0% |
| Afghans | 99.9 /100 | #57 | Exceptional 59.0% |
| Immigrants | Scotland | 99.8 /100 | #58 | Exceptional 58.9% |
Demographics Similar to Immigrants from North Macedonia by 2 or more Vehicles in Household
In terms of 2 or more vehicles in household, the demographic groups most similar to Immigrants from North Macedonia are Immigrants from Peru (54.4%, a difference of 0.040%), Immigrants from Italy (54.4%, a difference of 0.050%), Houma (54.4%, a difference of 0.070%), Immigrants from Norway (54.4%, a difference of 0.080%), and Immigrants from Belgium (54.3%, a difference of 0.090%).
| Demographics | Rating | Rank | 2 or more Vehicles in Household |
| Iroquois | 22.6 /100 | #195 | Fair 54.7% |
| Immigrants | Poland | 19.3 /100 | #196 | Poor 54.6% |
| Argentineans | 17.5 /100 | #197 | Poor 54.5% |
| Carpatho Rusyns | 16.2 /100 | #198 | Poor 54.4% |
| Immigrants | Norway | 15.9 /100 | #199 | Poor 54.4% |
| Houma | 15.8 /100 | #200 | Poor 54.4% |
| Immigrants | Italy | 15.5 /100 | #201 | Poor 54.4% |
| Immigrants | North Macedonia | 14.9 /100 | #202 | Poor 54.4% |
| Immigrants | Peru | 14.3 /100 | #203 | Poor 54.4% |
| Immigrants | Belgium | 13.7 /100 | #204 | Poor 54.3% |
| Cheyenne | 13.6 /100 | #205 | Poor 54.3% |
| Immigrants | Latin America | 13.1 /100 | #206 | Poor 54.3% |
| Turks | 13.0 /100 | #207 | Poor 54.3% |
| Egyptians | 12.0 /100 | #208 | Poor 54.3% |
| Immigrants | Bulgaria | 12.0 /100 | #209 | Poor 54.3% |