Moroccan vs Immigrants from North Macedonia 2 or more Vehicles in Household
COMPARE
Moroccan
Immigrants from North Macedonia
2 or more Vehicles in Household
2 or more Vehicles in Household Comparison
Moroccans
Immigrants from North Macedonia
48.8%
2 OR MORE VEHICLES IN HOUSEHOLD
0.0/ 100
METRIC RATING
309th/ 347
METRIC RANK
54.4%
2 OR MORE VEHICLES IN HOUSEHOLD
14.9/ 100
METRIC RATING
202nd/ 347
METRIC RANK
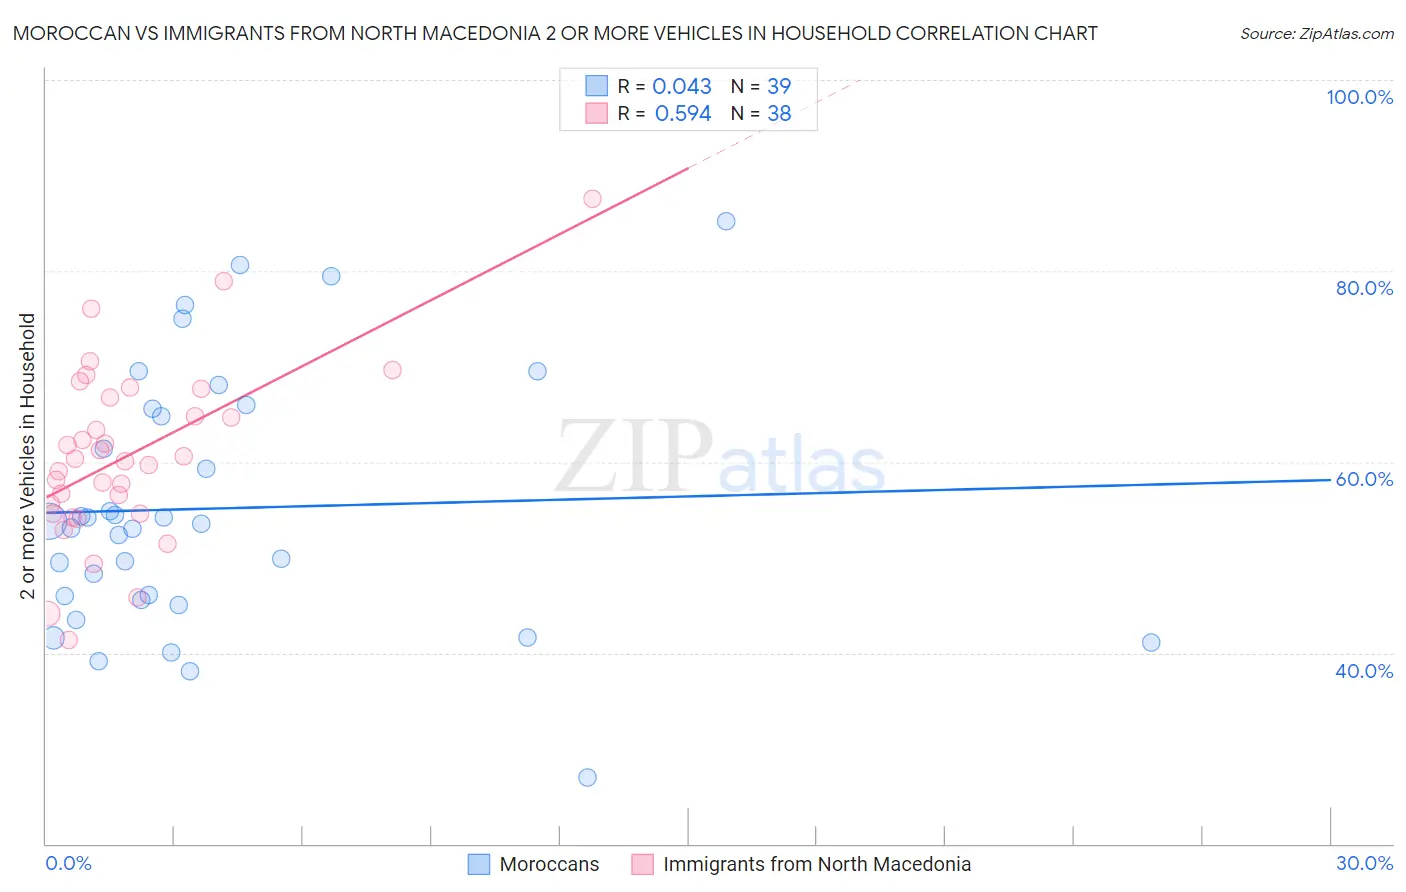
Moroccan vs Immigrants from North Macedonia 2 or more Vehicles in Household Correlation Chart
The statistical analysis conducted on geographies consisting of 201,766,092 people shows no correlation between the proportion of Moroccans and percentage of households with 2 or more vehicles available in the United States with a correlation coefficient (R) of 0.043 and weighted average of 48.8%. Similarly, the statistical analysis conducted on geographies consisting of 74,306,697 people shows a substantial positive correlation between the proportion of Immigrants from North Macedonia and percentage of households with 2 or more vehicles available in the United States with a correlation coefficient (R) of 0.594 and weighted average of 54.4%, a difference of 11.4%.
2 or more Vehicles in Household Correlation Summary
| Measurement | Moroccan | Immigrants from North Macedonia |
| Minimum | 27.0% | 41.4% |
| Maximum | 85.3% | 87.5% |
| Range | 58.3% | 46.1% |
| Mean | 55.1% | 60.7% |
| Median | 53.5% | 60.2% |
| Interquartile 25% (IQ1) | 45.6% | 54.6% |
| Interquartile 75% (IQ3) | 65.6% | 66.8% |
| Interquartile Range (IQR) | 20.0% | 12.2% |
| Standard Deviation (Sample) | 13.3% | 9.3% |
| Standard Deviation (Population) | 13.1% | 9.1% |
Similar Demographics by 2 or more Vehicles in Household
Demographics Similar to Moroccans by 2 or more Vehicles in Household
In terms of 2 or more vehicles in household, the demographic groups most similar to Moroccans are Albanian (49.0%, a difference of 0.35%), Hopi (49.0%, a difference of 0.42%), Immigrants from Israel (49.2%, a difference of 0.85%), Immigrants from Western Africa (49.4%, a difference of 1.1%), and Ghanaian (48.0%, a difference of 1.8%).
| Demographics | Rating | Rank | 2 or more Vehicles in Household |
| Immigrants | South America | 0.0 /100 | #302 | Tragic 50.2% |
| Tohono O'odham | 0.0 /100 | #303 | Tragic 50.0% |
| Immigrants | Belize | 0.0 /100 | #304 | Tragic 49.9% |
| Immigrants | Western Africa | 0.0 /100 | #305 | Tragic 49.4% |
| Immigrants | Israel | 0.0 /100 | #306 | Tragic 49.2% |
| Hopi | 0.0 /100 | #307 | Tragic 49.0% |
| Albanians | 0.0 /100 | #308 | Tragic 49.0% |
| Moroccans | 0.0 /100 | #309 | Tragic 48.8% |
| Ghanaians | 0.0 /100 | #310 | Tragic 48.0% |
| Immigrants | Belarus | 0.0 /100 | #311 | Tragic 47.9% |
| Haitians | 0.0 /100 | #312 | Tragic 47.6% |
| U.S. Virgin Islanders | 0.0 /100 | #313 | Tragic 47.5% |
| Immigrants | Ghana | 0.0 /100 | #314 | Tragic 47.4% |
| Puerto Ricans | 0.0 /100 | #315 | Tragic 47.1% |
| Cape Verdeans | 0.0 /100 | #316 | Tragic 46.8% |
Demographics Similar to Immigrants from North Macedonia by 2 or more Vehicles in Household
In terms of 2 or more vehicles in household, the demographic groups most similar to Immigrants from North Macedonia are Immigrants from Peru (54.4%, a difference of 0.040%), Immigrants from Italy (54.4%, a difference of 0.050%), Houma (54.4%, a difference of 0.070%), Immigrants from Norway (54.4%, a difference of 0.080%), and Immigrants from Belgium (54.3%, a difference of 0.090%).
| Demographics | Rating | Rank | 2 or more Vehicles in Household |
| Iroquois | 22.6 /100 | #195 | Fair 54.7% |
| Immigrants | Poland | 19.3 /100 | #196 | Poor 54.6% |
| Argentineans | 17.5 /100 | #197 | Poor 54.5% |
| Carpatho Rusyns | 16.2 /100 | #198 | Poor 54.4% |
| Immigrants | Norway | 15.9 /100 | #199 | Poor 54.4% |
| Houma | 15.8 /100 | #200 | Poor 54.4% |
| Immigrants | Italy | 15.5 /100 | #201 | Poor 54.4% |
| Immigrants | North Macedonia | 14.9 /100 | #202 | Poor 54.4% |
| Immigrants | Peru | 14.3 /100 | #203 | Poor 54.4% |
| Immigrants | Belgium | 13.7 /100 | #204 | Poor 54.3% |
| Cheyenne | 13.6 /100 | #205 | Poor 54.3% |
| Immigrants | Latin America | 13.1 /100 | #206 | Poor 54.3% |
| Turks | 13.0 /100 | #207 | Poor 54.3% |
| Egyptians | 12.0 /100 | #208 | Poor 54.3% |
| Immigrants | Bulgaria | 12.0 /100 | #209 | Poor 54.3% |