Spaniard vs Yup'ik 2 or more Vehicles in Household
COMPARE
Spaniard
Yup'ik
2 or more Vehicles in Household
2 or more Vehicles in Household Comparison
Spaniards
Yup'ik
59.2%
2 OR MORE VEHICLES IN HOUSEHOLD
99.9/ 100
METRIC RATING
51st/ 347
METRIC RANK
34.9%
2 OR MORE VEHICLES IN HOUSEHOLD
0.0/ 100
METRIC RATING
344th/ 347
METRIC RANK
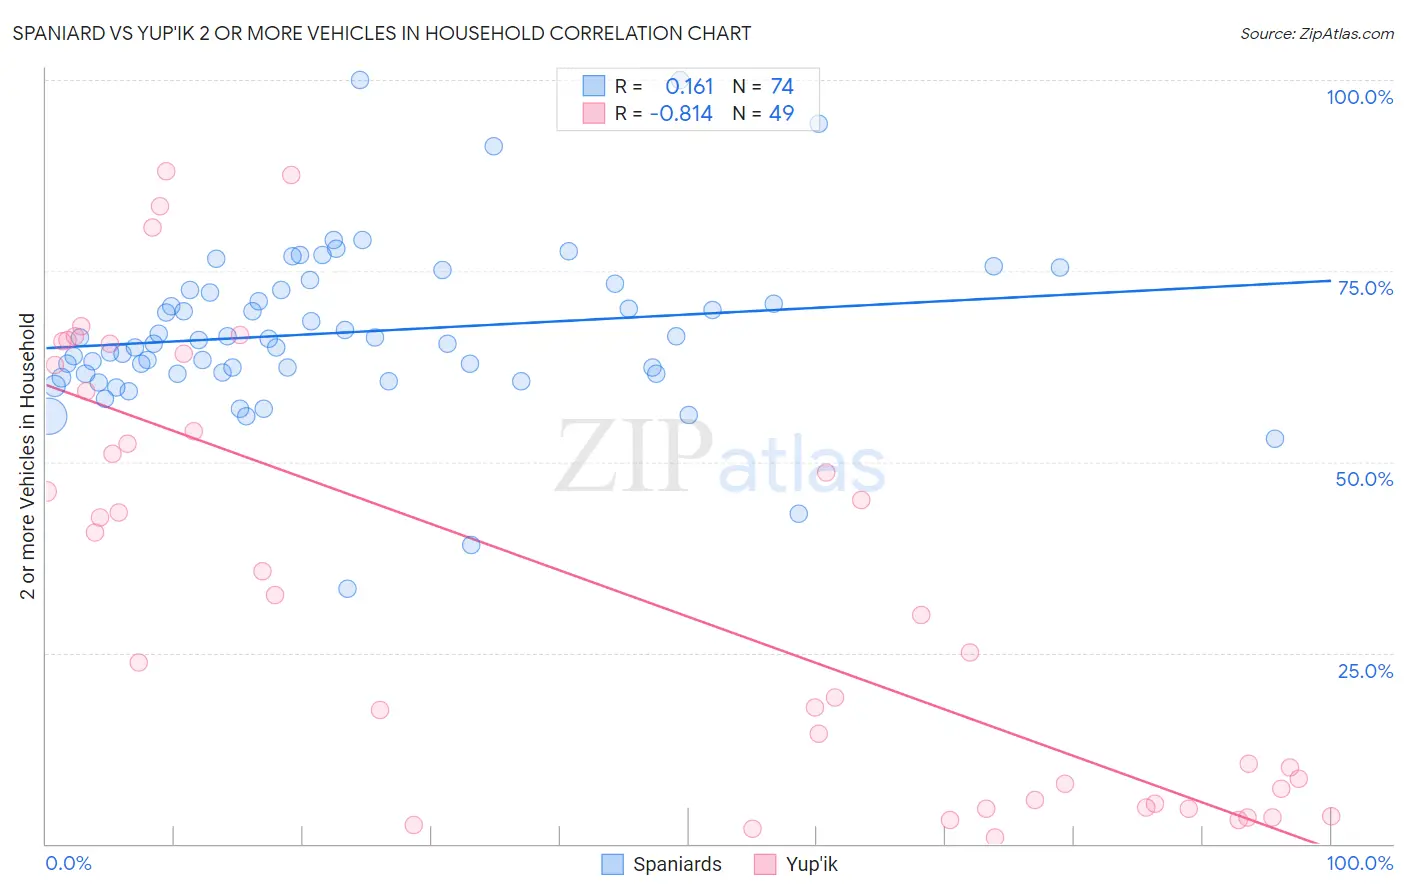
Spaniard vs Yup'ik 2 or more Vehicles in Household Correlation Chart
The statistical analysis conducted on geographies consisting of 443,212,223 people shows a poor positive correlation between the proportion of Spaniards and percentage of households with 2 or more vehicles available in the United States with a correlation coefficient (R) of 0.161 and weighted average of 59.2%. Similarly, the statistical analysis conducted on geographies consisting of 39,935,819 people shows a very strong negative correlation between the proportion of Yup'ik and percentage of households with 2 or more vehicles available in the United States with a correlation coefficient (R) of -0.814 and weighted average of 34.9%, a difference of 69.3%.
2 or more Vehicles in Household Correlation Summary
| Measurement | Spaniard | Yup'ik |
| Minimum | 33.3% | 0.83% |
| Maximum | 100.0% | 88.1% |
| Range | 66.7% | 87.3% |
| Mean | 66.9% | 33.8% |
| Median | 65.8% | 29.9% |
| Interquartile 25% (IQ1) | 61.6% | 5.5% |
| Interquartile 75% (IQ3) | 72.4% | 61.0% |
| Interquartile Range (IQR) | 10.9% | 55.5% |
| Standard Deviation (Sample) | 11.0% | 27.9% |
| Standard Deviation (Population) | 10.9% | 27.6% |
Similar Demographics by 2 or more Vehicles in Household
Demographics Similar to Spaniards by 2 or more Vehicles in Household
In terms of 2 or more vehicles in household, the demographic groups most similar to Spaniards are Immigrants from Laos (59.2%, a difference of 0.0%), Celtic (59.2%, a difference of 0.020%), Choctaw (59.3%, a difference of 0.14%), Belgian (59.3%, a difference of 0.15%), and Bhutanese (59.1%, a difference of 0.16%).
| Demographics | Rating | Rank | 2 or more Vehicles in Household |
| French | 100.0 /100 | #44 | Exceptional 59.8% |
| Immigrants | Taiwan | 100.0 /100 | #45 | Exceptional 59.7% |
| Immigrants | South Eastern Asia | 100.0 /100 | #46 | Exceptional 59.6% |
| Yaqui | 99.9 /100 | #47 | Exceptional 59.3% |
| Immigrants | India | 99.9 /100 | #48 | Exceptional 59.3% |
| Belgians | 99.9 /100 | #49 | Exceptional 59.3% |
| Choctaw | 99.9 /100 | #50 | Exceptional 59.3% |
| Spaniards | 99.9 /100 | #51 | Exceptional 59.2% |
| Immigrants | Laos | 99.9 /100 | #52 | Exceptional 59.2% |
| Celtics | 99.9 /100 | #53 | Exceptional 59.2% |
| Bhutanese | 99.9 /100 | #54 | Exceptional 59.1% |
| Luxembourgers | 99.9 /100 | #55 | Exceptional 59.1% |
| Chickasaw | 99.9 /100 | #56 | Exceptional 59.0% |
| Afghans | 99.9 /100 | #57 | Exceptional 59.0% |
| Immigrants | Scotland | 99.8 /100 | #58 | Exceptional 58.9% |
Demographics Similar to Yup'ik by 2 or more Vehicles in Household
In terms of 2 or more vehicles in household, the demographic groups most similar to Yup'ik are Immigrants from Guyana (35.0%, a difference of 0.17%), Dominican (35.3%, a difference of 1.1%), Guyanese (35.4%, a difference of 1.2%), British West Indian (35.4%, a difference of 1.3%), and Immigrants from Barbados (35.8%, a difference of 2.4%).
| Demographics | Rating | Rank | 2 or more Vehicles in Household |
| Immigrants | Ecuador | 0.0 /100 | #333 | Tragic 40.5% |
| Immigrants | Trinidad and Tobago | 0.0 /100 | #334 | Tragic 40.3% |
| Immigrants | Bangladesh | 0.0 /100 | #335 | Tragic 38.8% |
| Vietnamese | 0.0 /100 | #336 | Tragic 38.5% |
| Barbadians | 0.0 /100 | #337 | Tragic 38.3% |
| Immigrants | Uzbekistan | 0.0 /100 | #338 | Tragic 37.9% |
| Immigrants | Barbados | 0.0 /100 | #339 | Tragic 35.8% |
| British West Indians | 0.0 /100 | #340 | Tragic 35.4% |
| Guyanese | 0.0 /100 | #341 | Tragic 35.4% |
| Dominicans | 0.0 /100 | #342 | Tragic 35.3% |
| Immigrants | Guyana | 0.0 /100 | #343 | Tragic 35.0% |
| Yup'ik | 0.0 /100 | #344 | Tragic 34.9% |
| Immigrants | Dominican Republic | 0.0 /100 | #345 | Tragic 33.2% |
| Immigrants | St. Vincent and the Grenadines | 0.0 /100 | #346 | Tragic 31.0% |
| Immigrants | Grenada | 0.0 /100 | #347 | Tragic 28.7% |