Spaniard vs Immigrants from North Macedonia Child Poverty Under the Age of 16
COMPARE
Spaniard
Immigrants from North Macedonia
Child Poverty Under the Age of 16
Child Poverty Under the Age of 16 Comparison
Spaniards
Immigrants from North Macedonia
16.8%
CHILD POVERTY UNDER THE AGE OF 16
23.2/ 100
METRIC RATING
193rd/ 347
METRIC RANK
14.5%
CHILD POVERTY UNDER THE AGE OF 16
97.2/ 100
METRIC RATING
80th/ 347
METRIC RANK
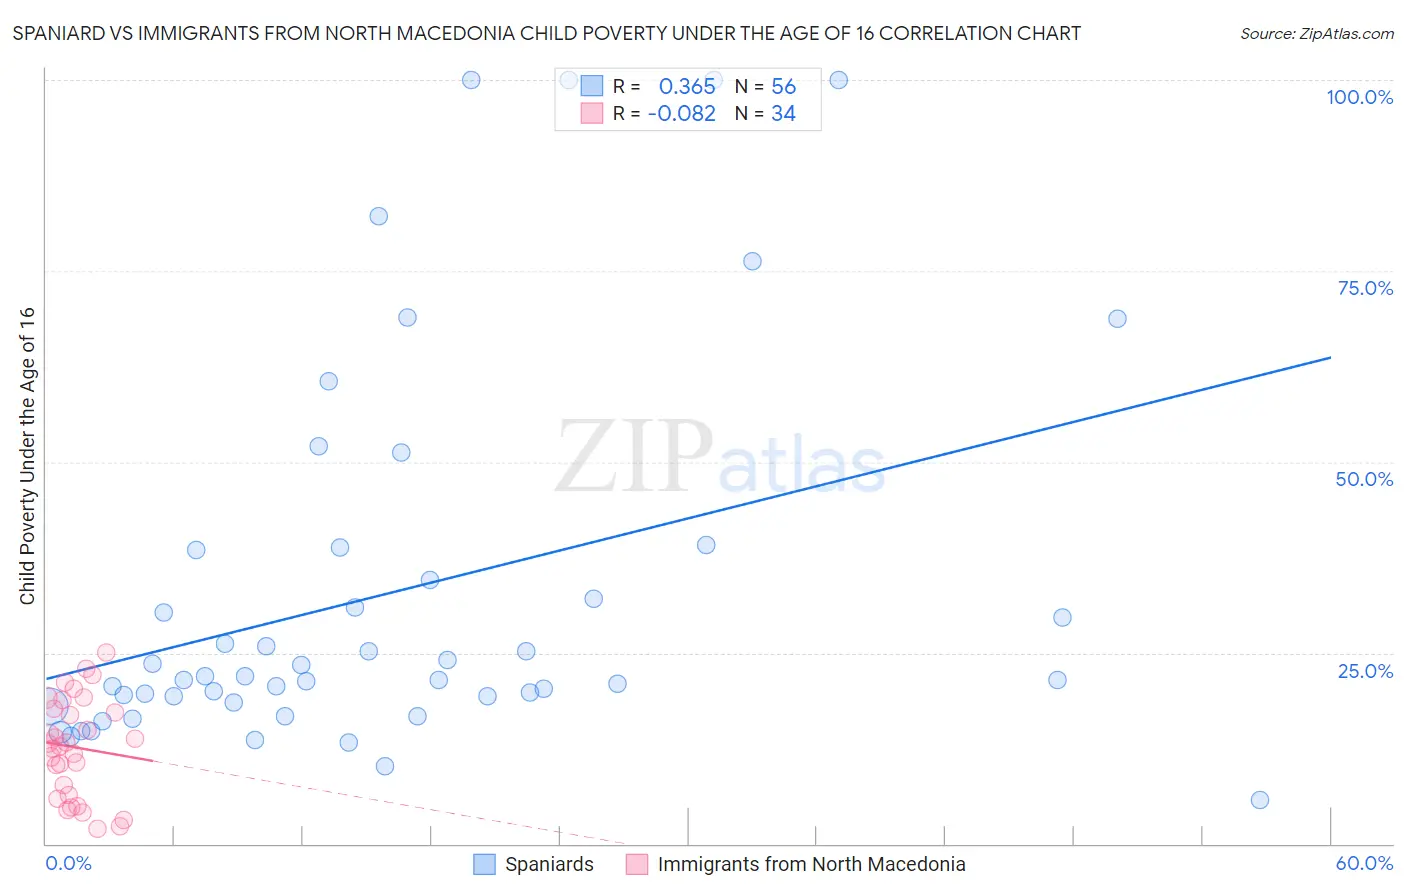
Spaniard vs Immigrants from North Macedonia Child Poverty Under the Age of 16 Correlation Chart
The statistical analysis conducted on geographies consisting of 438,691,641 people shows a mild positive correlation between the proportion of Spaniards and poverty level among children under the age of 16 in the United States with a correlation coefficient (R) of 0.365 and weighted average of 16.8%. Similarly, the statistical analysis conducted on geographies consisting of 73,988,671 people shows a slight negative correlation between the proportion of Immigrants from North Macedonia and poverty level among children under the age of 16 in the United States with a correlation coefficient (R) of -0.082 and weighted average of 14.5%, a difference of 16.0%.
Child Poverty Under the Age of 16 Correlation Summary
| Measurement | Spaniard | Immigrants from North Macedonia |
| Minimum | 5.7% | 2.0% |
| Maximum | 100.0% | 25.1% |
| Range | 94.3% | 23.1% |
| Mean | 32.9% | 12.6% |
| Median | 21.7% | 12.9% |
| Interquartile 25% (IQ1) | 18.9% | 6.4% |
| Interquartile 75% (IQ3) | 36.5% | 17.6% |
| Interquartile Range (IQR) | 17.7% | 11.2% |
| Standard Deviation (Sample) | 25.0% | 6.5% |
| Standard Deviation (Population) | 24.7% | 6.4% |
Similar Demographics by Child Poverty Under the Age of 16
Demographics Similar to Spaniards by Child Poverty Under the Age of 16
In terms of child poverty under the age of 16, the demographic groups most similar to Spaniards are Immigrants from Uruguay (16.8%, a difference of 0.020%), Immigrants from Uganda (16.8%, a difference of 0.11%), Immigrants from Lebanon (16.8%, a difference of 0.19%), Spanish (16.7%, a difference of 0.20%), and Immigrants from Kenya (16.9%, a difference of 0.71%).
| Demographics | Rating | Rank | Child Poverty Under the Age of 16 |
| Kenyans | 34.1 /100 | #186 | Fair 16.5% |
| Arabs | 31.4 /100 | #187 | Fair 16.6% |
| Immigrants | Morocco | 31.2 /100 | #188 | Fair 16.6% |
| Immigrants | Portugal | 30.0 /100 | #189 | Fair 16.6% |
| Immigrants | Costa Rica | 29.6 /100 | #190 | Fair 16.6% |
| Immigrants | Iraq | 28.3 /100 | #191 | Fair 16.7% |
| Spanish | 24.5 /100 | #192 | Fair 16.7% |
| Spaniards | 23.2 /100 | #193 | Fair 16.8% |
| Immigrants | Uruguay | 23.1 /100 | #194 | Fair 16.8% |
| Immigrants | Uganda | 22.5 /100 | #195 | Fair 16.8% |
| Immigrants | Lebanon | 22.0 /100 | #196 | Fair 16.8% |
| Immigrants | Kenya | 19.1 /100 | #197 | Poor 16.9% |
| Delaware | 17.1 /100 | #198 | Poor 17.0% |
| Immigrants | Afghanistan | 15.1 /100 | #199 | Poor 17.0% |
| Immigrants | Cameroon | 14.7 /100 | #200 | Poor 17.1% |
Demographics Similar to Immigrants from North Macedonia by Child Poverty Under the Age of 16
In terms of child poverty under the age of 16, the demographic groups most similar to Immigrants from North Macedonia are Finnish (14.5%, a difference of 0.030%), Immigrants from Canada (14.5%, a difference of 0.060%), Swiss (14.5%, a difference of 0.070%), Egyptian (14.5%, a difference of 0.090%), and Immigrants from Russia (14.5%, a difference of 0.10%).
| Demographics | Rating | Rank | Child Poverty Under the Age of 16 |
| Immigrants | Turkey | 97.6 /100 | #73 | Exceptional 14.4% |
| Macedonians | 97.6 /100 | #74 | Exceptional 14.4% |
| Ukrainians | 97.5 /100 | #75 | Exceptional 14.4% |
| Immigrants | Eastern Europe | 97.5 /100 | #76 | Exceptional 14.4% |
| Australians | 97.5 /100 | #77 | Exceptional 14.4% |
| Immigrants | Russia | 97.3 /100 | #78 | Exceptional 14.5% |
| Swiss | 97.3 /100 | #79 | Exceptional 14.5% |
| Immigrants | North Macedonia | 97.2 /100 | #80 | Exceptional 14.5% |
| Finns | 97.2 /100 | #81 | Exceptional 14.5% |
| Immigrants | Canada | 97.2 /100 | #82 | Exceptional 14.5% |
| Egyptians | 97.2 /100 | #83 | Exceptional 14.5% |
| Immigrants | Latvia | 97.1 /100 | #84 | Exceptional 14.5% |
| Soviet Union | 97.1 /100 | #85 | Exceptional 14.5% |
| Immigrants | Argentina | 97.1 /100 | #86 | Exceptional 14.5% |
| Taiwanese | 97.1 /100 | #87 | Exceptional 14.5% |