Immigrants from Jamaica vs Immigrants from North Macedonia 2 or more Vehicles in Household
COMPARE
Immigrants from Jamaica
Immigrants from North Macedonia
2 or more Vehicles in Household
2 or more Vehicles in Household Comparison
Immigrants from Jamaica
Immigrants from North Macedonia
44.5%
2 OR MORE VEHICLES IN HOUSEHOLD
0.0/ 100
METRIC RATING
321st/ 347
METRIC RANK
54.4%
2 OR MORE VEHICLES IN HOUSEHOLD
14.9/ 100
METRIC RATING
202nd/ 347
METRIC RANK
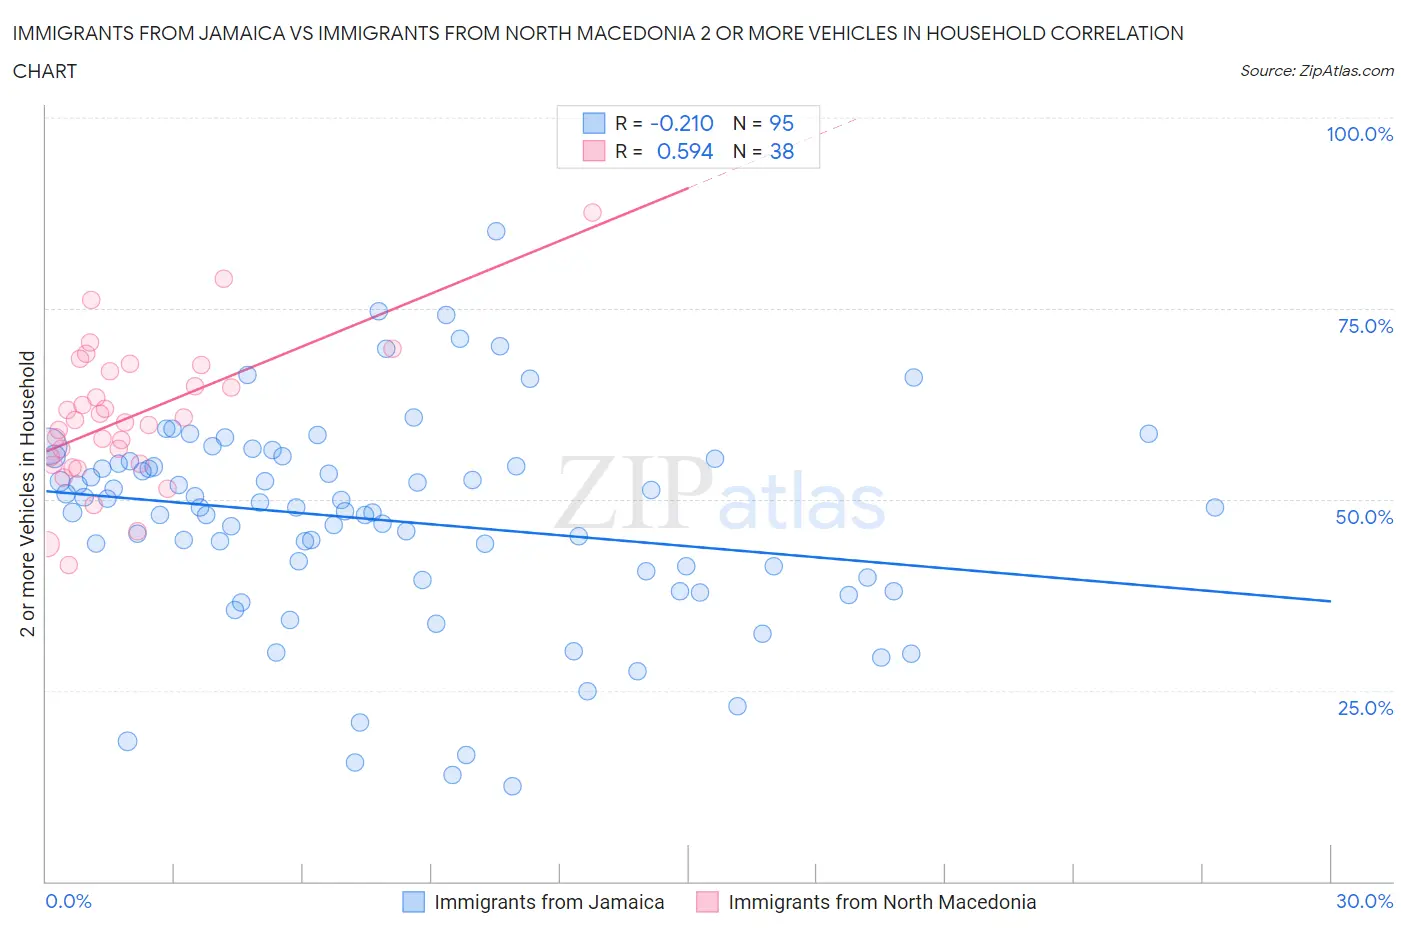
Immigrants from Jamaica vs Immigrants from North Macedonia 2 or more Vehicles in Household Correlation Chart
The statistical analysis conducted on geographies consisting of 301,616,256 people shows a weak negative correlation between the proportion of Immigrants from Jamaica and percentage of households with 2 or more vehicles available in the United States with a correlation coefficient (R) of -0.210 and weighted average of 44.5%. Similarly, the statistical analysis conducted on geographies consisting of 74,306,697 people shows a substantial positive correlation between the proportion of Immigrants from North Macedonia and percentage of households with 2 or more vehicles available in the United States with a correlation coefficient (R) of 0.594 and weighted average of 54.4%, a difference of 22.3%.
2 or more Vehicles in Household Correlation Summary
| Measurement | Immigrants from Jamaica | Immigrants from North Macedonia |
| Minimum | 12.4% | 41.4% |
| Maximum | 85.1% | 87.5% |
| Range | 72.7% | 46.1% |
| Mean | 47.3% | 60.7% |
| Median | 49.0% | 60.2% |
| Interquartile 25% (IQ1) | 39.8% | 54.6% |
| Interquartile 75% (IQ3) | 55.0% | 66.8% |
| Interquartile Range (IQR) | 15.2% | 12.2% |
| Standard Deviation (Sample) | 13.8% | 9.3% |
| Standard Deviation (Population) | 13.7% | 9.1% |
Similar Demographics by 2 or more Vehicles in Household
Demographics Similar to Immigrants from Jamaica by 2 or more Vehicles in Household
In terms of 2 or more vehicles in household, the demographic groups most similar to Immigrants from Jamaica are Senegalese (44.2%, a difference of 0.55%), Immigrants from Caribbean (44.2%, a difference of 0.57%), Immigrants from Cabo Verde (43.3%, a difference of 2.6%), Soviet Union (45.7%, a difference of 2.9%), and Jamaican (45.8%, a difference of 2.9%).
| Demographics | Rating | Rank | 2 or more Vehicles in Household |
| Immigrants | Ghana | 0.0 /100 | #314 | Tragic 47.4% |
| Puerto Ricans | 0.0 /100 | #315 | Tragic 47.1% |
| Cape Verdeans | 0.0 /100 | #316 | Tragic 46.8% |
| Immigrants | Haiti | 0.0 /100 | #317 | Tragic 46.5% |
| Immigrants | Albania | 0.0 /100 | #318 | Tragic 46.0% |
| Jamaicans | 0.0 /100 | #319 | Tragic 45.8% |
| Soviet Union | 0.0 /100 | #320 | Tragic 45.7% |
| Immigrants | Jamaica | 0.0 /100 | #321 | Tragic 44.5% |
| Senegalese | 0.0 /100 | #322 | Tragic 44.2% |
| Immigrants | Caribbean | 0.0 /100 | #323 | Tragic 44.2% |
| Immigrants | Cabo Verde | 0.0 /100 | #324 | Tragic 43.3% |
| Immigrants | West Indies | 0.0 /100 | #325 | Tragic 43.1% |
| Immigrants | Senegal | 0.0 /100 | #326 | Tragic 43.0% |
| Immigrants | Yemen | 0.0 /100 | #327 | Tragic 42.8% |
| Inupiat | 0.0 /100 | #328 | Tragic 42.6% |
Demographics Similar to Immigrants from North Macedonia by 2 or more Vehicles in Household
In terms of 2 or more vehicles in household, the demographic groups most similar to Immigrants from North Macedonia are Immigrants from Peru (54.4%, a difference of 0.040%), Immigrants from Italy (54.4%, a difference of 0.050%), Houma (54.4%, a difference of 0.070%), Immigrants from Norway (54.4%, a difference of 0.080%), and Immigrants from Belgium (54.3%, a difference of 0.090%).
| Demographics | Rating | Rank | 2 or more Vehicles in Household |
| Iroquois | 22.6 /100 | #195 | Fair 54.7% |
| Immigrants | Poland | 19.3 /100 | #196 | Poor 54.6% |
| Argentineans | 17.5 /100 | #197 | Poor 54.5% |
| Carpatho Rusyns | 16.2 /100 | #198 | Poor 54.4% |
| Immigrants | Norway | 15.9 /100 | #199 | Poor 54.4% |
| Houma | 15.8 /100 | #200 | Poor 54.4% |
| Immigrants | Italy | 15.5 /100 | #201 | Poor 54.4% |
| Immigrants | North Macedonia | 14.9 /100 | #202 | Poor 54.4% |
| Immigrants | Peru | 14.3 /100 | #203 | Poor 54.4% |
| Immigrants | Belgium | 13.7 /100 | #204 | Poor 54.3% |
| Cheyenne | 13.6 /100 | #205 | Poor 54.3% |
| Immigrants | Latin America | 13.1 /100 | #206 | Poor 54.3% |
| Turks | 13.0 /100 | #207 | Poor 54.3% |
| Egyptians | 12.0 /100 | #208 | Poor 54.3% |
| Immigrants | Bulgaria | 12.0 /100 | #209 | Poor 54.3% |