Spaniard vs Arapaho 2 or more Vehicles in Household
COMPARE
Spaniard
Arapaho
2 or more Vehicles in Household
2 or more Vehicles in Household Comparison
Spaniards
Arapaho
59.2%
2 OR MORE VEHICLES IN HOUSEHOLD
99.9/ 100
METRIC RATING
51st/ 347
METRIC RANK
60.2%
2 OR MORE VEHICLES IN HOUSEHOLD
100.0/ 100
METRIC RATING
32nd/ 347
METRIC RANK
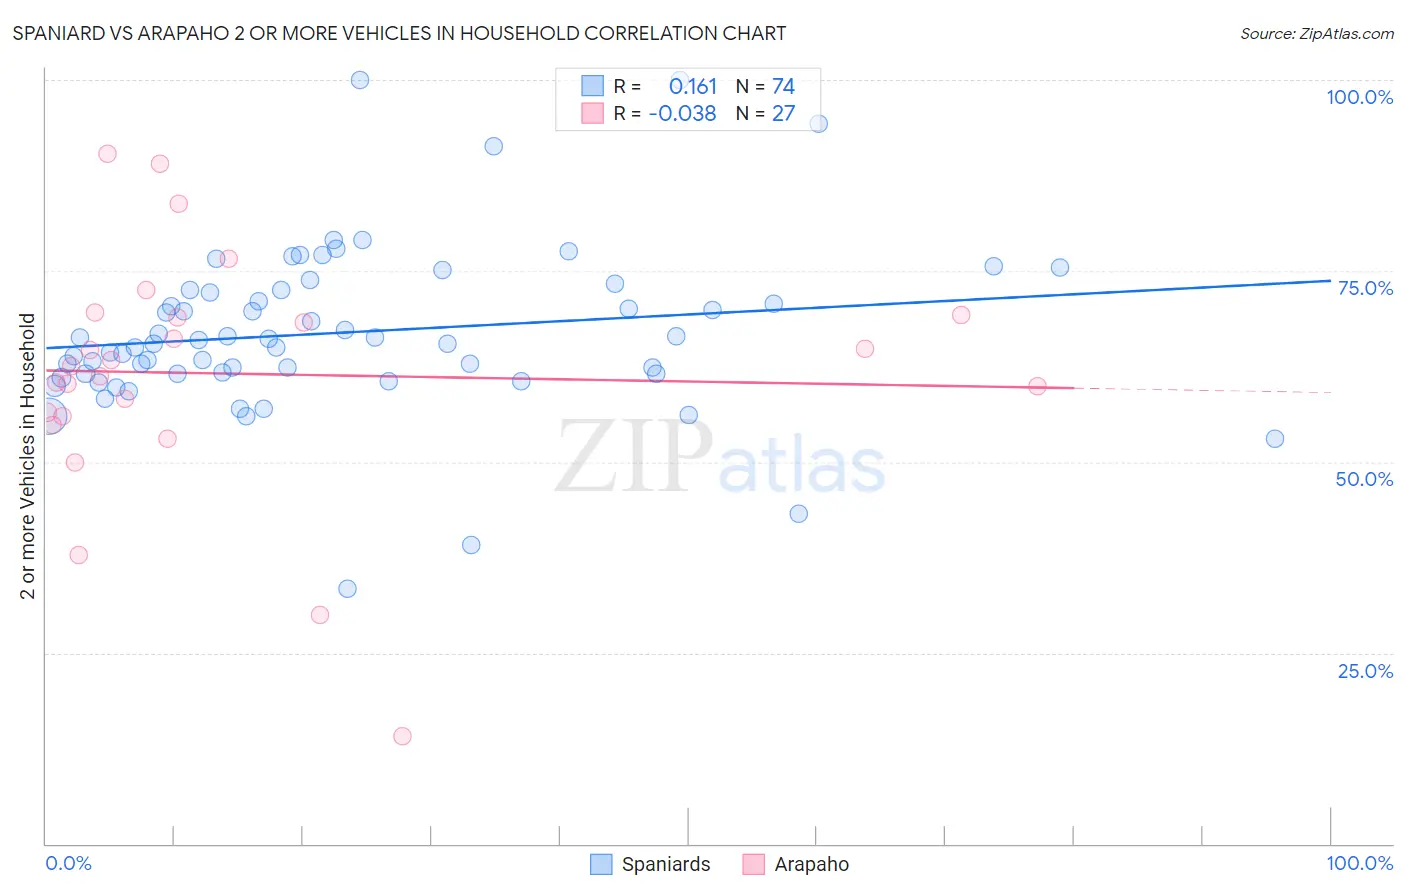
Spaniard vs Arapaho 2 or more Vehicles in Household Correlation Chart
The statistical analysis conducted on geographies consisting of 443,212,223 people shows a poor positive correlation between the proportion of Spaniards and percentage of households with 2 or more vehicles available in the United States with a correlation coefficient (R) of 0.161 and weighted average of 59.2%. Similarly, the statistical analysis conducted on geographies consisting of 29,778,572 people shows no correlation between the proportion of Arapaho and percentage of households with 2 or more vehicles available in the United States with a correlation coefficient (R) of -0.038 and weighted average of 60.2%, a difference of 1.8%.
2 or more Vehicles in Household Correlation Summary
| Measurement | Spaniard | Arapaho |
| Minimum | 33.3% | 14.1% |
| Maximum | 100.0% | 90.3% |
| Range | 66.7% | 76.2% |
| Mean | 66.9% | 61.5% |
| Median | 65.8% | 62.5% |
| Interquartile 25% (IQ1) | 61.6% | 56.0% |
| Interquartile 75% (IQ3) | 72.4% | 69.3% |
| Interquartile Range (IQR) | 10.9% | 13.3% |
| Standard Deviation (Sample) | 11.0% | 16.2% |
| Standard Deviation (Population) | 10.9% | 15.9% |
Demographics Similar to Spaniards and Arapaho by 2 or more Vehicles in Household
In terms of 2 or more vehicles in household, the demographic groups most similar to Spaniards are Choctaw (59.3%, a difference of 0.14%), Belgian (59.3%, a difference of 0.15%), Immigrants from India (59.3%, a difference of 0.18%), Yaqui (59.3%, a difference of 0.20%), and Immigrants from South Eastern Asia (59.6%, a difference of 0.71%). Similarly, the demographic groups most similar to Arapaho are Immigrants from Mexico (60.2%, a difference of 0.060%), Spanish American Indian (60.3%, a difference of 0.11%), Spanish (60.2%, a difference of 0.11%), Immigrants from Philippines (60.1%, a difference of 0.23%), and Chinese (60.1%, a difference of 0.25%).
| Demographics | Rating | Rank | 2 or more Vehicles in Household |
| Spanish American Indians | 100.0 /100 | #31 | Exceptional 60.3% |
| Arapaho | 100.0 /100 | #32 | Exceptional 60.2% |
| Immigrants | Mexico | 100.0 /100 | #33 | Exceptional 60.2% |
| Spanish | 100.0 /100 | #34 | Exceptional 60.2% |
| Immigrants | Philippines | 100.0 /100 | #35 | Exceptional 60.1% |
| Chinese | 100.0 /100 | #36 | Exceptional 60.1% |
| Irish | 100.0 /100 | #37 | Exceptional 60.1% |
| Americans | 100.0 /100 | #38 | Exceptional 60.0% |
| British | 100.0 /100 | #39 | Exceptional 60.0% |
| Cherokee | 100.0 /100 | #40 | Exceptional 59.9% |
| Northern Europeans | 100.0 /100 | #41 | Exceptional 59.9% |
| Malaysians | 100.0 /100 | #42 | Exceptional 59.8% |
| Czechoslovakians | 100.0 /100 | #43 | Exceptional 59.8% |
| French | 100.0 /100 | #44 | Exceptional 59.8% |
| Immigrants | Taiwan | 100.0 /100 | #45 | Exceptional 59.7% |
| Immigrants | South Eastern Asia | 100.0 /100 | #46 | Exceptional 59.6% |
| Yaqui | 99.9 /100 | #47 | Exceptional 59.3% |
| Immigrants | India | 99.9 /100 | #48 | Exceptional 59.3% |
| Belgians | 99.9 /100 | #49 | Exceptional 59.3% |
| Choctaw | 99.9 /100 | #50 | Exceptional 59.3% |
| Spaniards | 99.9 /100 | #51 | Exceptional 59.2% |