Spaniard vs Immigrants from Colombia No Schooling Completed
COMPARE
Spaniard
Immigrants from Colombia
No Schooling Completed
No Schooling Completed Comparison
Spaniards
Immigrants from Colombia
1.9%
NO SCHOOLING COMPLETED
92.3/ 100
METRIC RATING
128th/ 347
METRIC RANK
2.4%
NO SCHOOLING COMPLETED
1.0/ 100
METRIC RATING
252nd/ 347
METRIC RANK
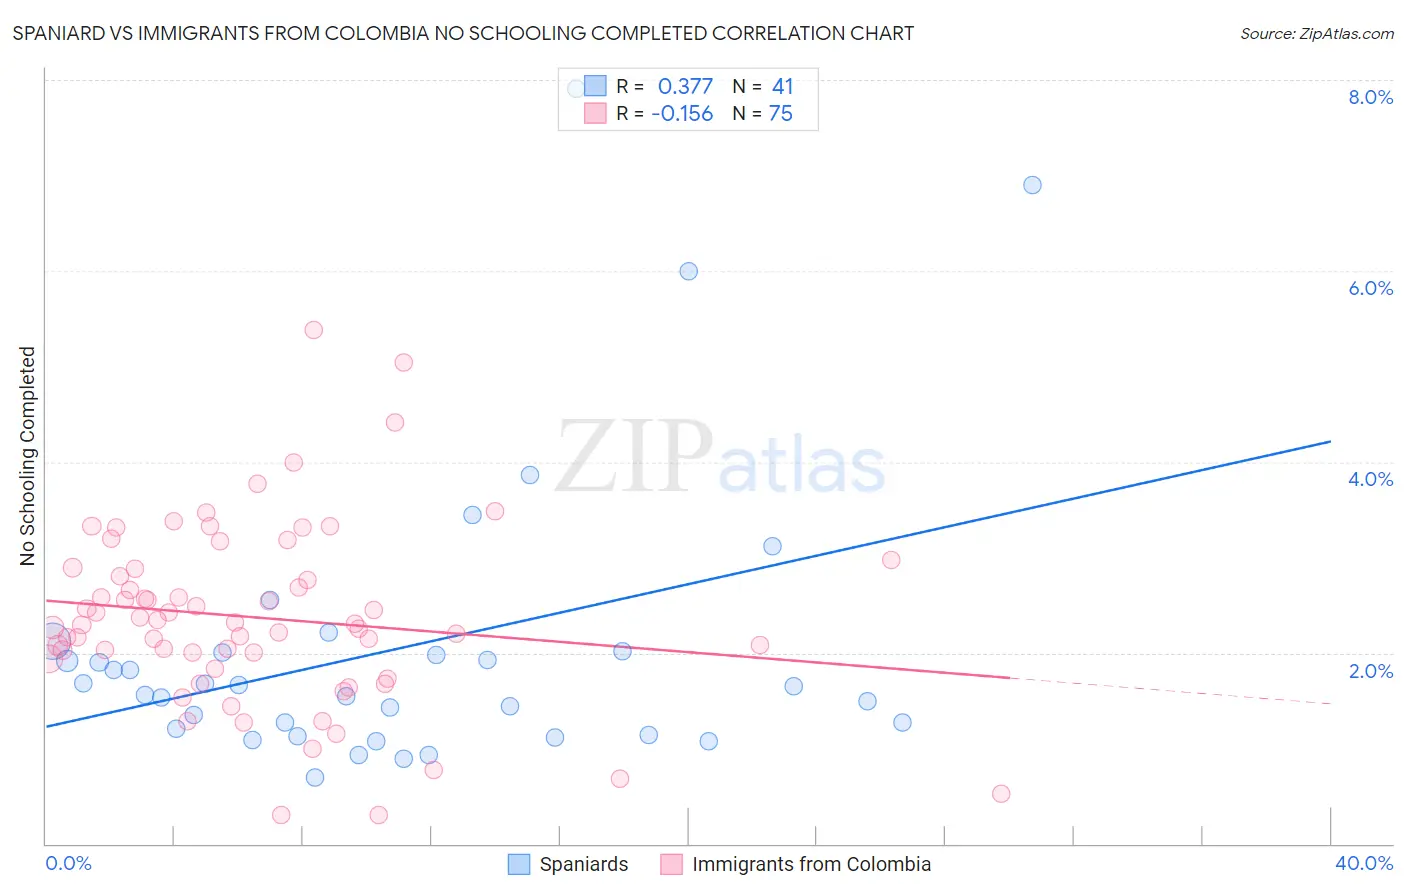
Spaniard vs Immigrants from Colombia No Schooling Completed Correlation Chart
The statistical analysis conducted on geographies consisting of 437,809,965 people shows a mild positive correlation between the proportion of Spaniards and percentage of population with no schooling in the United States with a correlation coefficient (R) of 0.377 and weighted average of 1.9%. Similarly, the statistical analysis conducted on geographies consisting of 375,786,629 people shows a poor negative correlation between the proportion of Immigrants from Colombia and percentage of population with no schooling in the United States with a correlation coefficient (R) of -0.156 and weighted average of 2.4%, a difference of 26.0%.
No Schooling Completed Correlation Summary
| Measurement | Spaniard | Immigrants from Colombia |
| Minimum | 0.69% | 0.30% |
| Maximum | 7.9% | 5.4% |
| Range | 7.2% | 5.1% |
| Mean | 2.1% | 2.4% |
| Median | 1.7% | 2.3% |
| Interquartile 25% (IQ1) | 1.2% | 1.9% |
| Interquartile 75% (IQ3) | 2.0% | 2.9% |
| Interquartile Range (IQR) | 0.84% | 0.94% |
| Standard Deviation (Sample) | 1.6% | 0.95% |
| Standard Deviation (Population) | 1.5% | 0.94% |
Similar Demographics by No Schooling Completed
Demographics Similar to Spaniards by No Schooling Completed
In terms of no schooling completed, the demographic groups most similar to Spaniards are Israeli (1.9%, a difference of 0.090%), Seminole (1.9%, a difference of 0.14%), Immigrants from Romania (1.9%, a difference of 0.15%), Palestinian (1.9%, a difference of 0.25%), and Immigrants from Hungary (1.9%, a difference of 0.35%).
| Demographics | Rating | Rank | No Schooling Completed |
| Immigrants | Croatia | 94.5 /100 | #121 | Exceptional 1.9% |
| Cree | 94.5 /100 | #122 | Exceptional 1.9% |
| Immigrants | Kuwait | 93.9 /100 | #123 | Exceptional 1.9% |
| Cambodians | 93.8 /100 | #124 | Exceptional 1.9% |
| Immigrants | Europe | 93.7 /100 | #125 | Exceptional 1.9% |
| Immigrants | Romania | 92.6 /100 | #126 | Exceptional 1.9% |
| Israelis | 92.4 /100 | #127 | Exceptional 1.9% |
| Spaniards | 92.3 /100 | #128 | Exceptional 1.9% |
| Seminole | 92.0 /100 | #129 | Exceptional 1.9% |
| Palestinians | 91.8 /100 | #130 | Exceptional 1.9% |
| Immigrants | Hungary | 91.6 /100 | #131 | Exceptional 1.9% |
| Colville | 90.4 /100 | #132 | Exceptional 1.9% |
| Immigrants | Turkey | 90.2 /100 | #133 | Exceptional 1.9% |
| Menominee | 89.6 /100 | #134 | Excellent 1.9% |
| Hmong | 88.5 /100 | #135 | Excellent 1.9% |
Demographics Similar to Immigrants from Colombia by No Schooling Completed
In terms of no schooling completed, the demographic groups most similar to Immigrants from Colombia are Immigrants from Asia (2.4%, a difference of 0.13%), Immigrants from Eastern Africa (2.4%, a difference of 0.25%), Immigrants from Africa (2.4%, a difference of 0.45%), Ethiopian (2.4%, a difference of 0.45%), and Immigrants from Middle Africa (2.4%, a difference of 0.46%).
| Demographics | Rating | Rank | No Schooling Completed |
| Bolivians | 1.4 /100 | #245 | Tragic 2.4% |
| Immigrants | Congo | 1.4 /100 | #246 | Tragic 2.4% |
| Immigrants | Iraq | 1.3 /100 | #247 | Tragic 2.4% |
| Asians | 1.2 /100 | #248 | Tragic 2.4% |
| Jamaicans | 1.2 /100 | #249 | Tragic 2.4% |
| Immigrants | Middle Africa | 1.1 /100 | #250 | Tragic 2.4% |
| Immigrants | Africa | 1.1 /100 | #251 | Tragic 2.4% |
| Immigrants | Colombia | 1.0 /100 | #252 | Tragic 2.4% |
| Immigrants | Asia | 0.9 /100 | #253 | Tragic 2.4% |
| Immigrants | Eastern Africa | 0.9 /100 | #254 | Tragic 2.4% |
| Ethiopians | 0.8 /100 | #255 | Tragic 2.4% |
| Yaqui | 0.8 /100 | #256 | Tragic 2.4% |
| Immigrants | South America | 0.6 /100 | #257 | Tragic 2.5% |
| Assyrians/Chaldeans/Syriacs | 0.6 /100 | #258 | Tragic 2.5% |
| Immigrants | Jamaica | 0.6 /100 | #259 | Tragic 2.5% |