Soviet Union vs Choctaw 3 or more Vehicles in Household
COMPARE
Soviet Union
Choctaw
3 or more Vehicles in Household
3 or more Vehicles in Household Comparison
Soviet Union
Choctaw
14.2%
3 OR MORE VEHICLES IN HOUSEHOLD
0.0/ 100
METRIC RATING
326th/ 347
METRIC RANK
23.0%
3 OR MORE VEHICLES IN HOUSEHOLD
100.0/ 100
METRIC RATING
35th/ 347
METRIC RANK
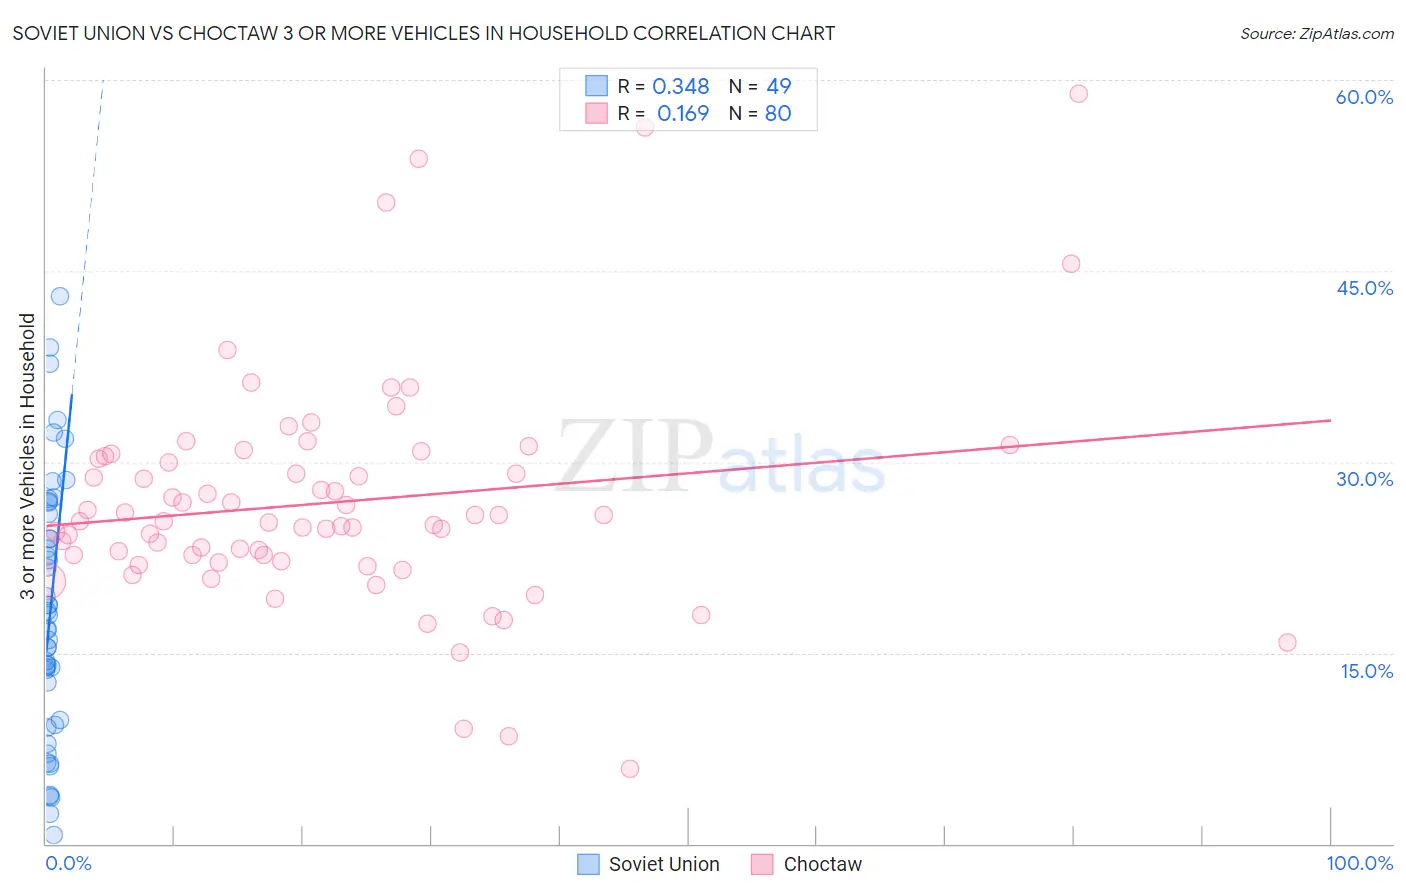
Soviet Union vs Choctaw 3 or more Vehicles in Household Correlation Chart
The statistical analysis conducted on geographies consisting of 43,505,589 people shows a mild positive correlation between the proportion of Soviet Union and percentage of households with 3 or more vehicles available in the United States with a correlation coefficient (R) of 0.348 and weighted average of 14.2%. Similarly, the statistical analysis conducted on geographies consisting of 269,608,745 people shows a poor positive correlation between the proportion of Choctaw and percentage of households with 3 or more vehicles available in the United States with a correlation coefficient (R) of 0.169 and weighted average of 23.0%, a difference of 62.2%.
3 or more Vehicles in Household Correlation Summary
| Measurement | Soviet Union | Choctaw |
| Minimum | 0.69% | 5.9% |
| Maximum | 43.0% | 58.9% |
| Range | 42.4% | 53.0% |
| Mean | 18.2% | 26.8% |
| Median | 16.9% | 25.3% |
| Interquartile 25% (IQ1) | 9.5% | 22.4% |
| Interquartile 75% (IQ3) | 26.4% | 30.4% |
| Interquartile Range (IQR) | 16.8% | 7.9% |
| Standard Deviation (Sample) | 10.2% | 9.1% |
| Standard Deviation (Population) | 10.1% | 9.0% |
Similar Demographics by 3 or more Vehicles in Household
Demographics Similar to Soviet Union by 3 or more Vehicles in Household
In terms of 3 or more vehicles in household, the demographic groups most similar to Soviet Union are Senegalese (14.2%, a difference of 0.33%), Immigrants from Yemen (14.2%, a difference of 0.41%), Ecuadorian (14.1%, a difference of 0.89%), Immigrants from Albania (14.0%, a difference of 1.6%), and Immigrants from Caribbean (14.6%, a difference of 2.7%).
| Demographics | Rating | Rank | 3 or more Vehicles in Household |
| Cape Verdeans | 0.0 /100 | #319 | Tragic 15.0% |
| Yup'ik | 0.0 /100 | #320 | Tragic 14.8% |
| Immigrants | Jamaica | 0.0 /100 | #321 | Tragic 14.7% |
| Immigrants | West Indies | 0.0 /100 | #322 | Tragic 14.6% |
| Immigrants | Caribbean | 0.0 /100 | #323 | Tragic 14.6% |
| Immigrants | Yemen | 0.0 /100 | #324 | Tragic 14.2% |
| Senegalese | 0.0 /100 | #325 | Tragic 14.2% |
| Soviet Union | 0.0 /100 | #326 | Tragic 14.2% |
| Ecuadorians | 0.0 /100 | #327 | Tragic 14.1% |
| Immigrants | Albania | 0.0 /100 | #328 | Tragic 14.0% |
| Immigrants | Senegal | 0.0 /100 | #329 | Tragic 13.8% |
| West Indians | 0.0 /100 | #330 | Tragic 13.7% |
| Immigrants | Dominica | 0.0 /100 | #331 | Tragic 13.7% |
| Trinidadians and Tobagonians | 0.0 /100 | #332 | Tragic 13.6% |
| Immigrants | Cabo Verde | 0.0 /100 | #333 | Tragic 13.6% |
Demographics Similar to Choctaw by 3 or more Vehicles in Household
In terms of 3 or more vehicles in household, the demographic groups most similar to Choctaw are Swiss (23.0%, a difference of 0.020%), Cherokee (23.0%, a difference of 0.040%), Spanish American (23.0%, a difference of 0.070%), Swedish (23.0%, a difference of 0.070%), and Pueblo (23.0%, a difference of 0.13%).
| Demographics | Rating | Rank | 3 or more Vehicles in Household |
| Lumbee | 100.0 /100 | #28 | Exceptional 23.1% |
| Spanish | 100.0 /100 | #29 | Exceptional 23.1% |
| Immigrants | South Eastern Asia | 100.0 /100 | #30 | Exceptional 23.1% |
| English | 100.0 /100 | #31 | Exceptional 23.1% |
| Pueblo | 100.0 /100 | #32 | Exceptional 23.0% |
| Spanish Americans | 100.0 /100 | #33 | Exceptional 23.0% |
| Swiss | 100.0 /100 | #34 | Exceptional 23.0% |
| Choctaw | 100.0 /100 | #35 | Exceptional 23.0% |
| Cherokee | 100.0 /100 | #36 | Exceptional 23.0% |
| Swedes | 100.0 /100 | #37 | Exceptional 23.0% |
| Dutch | 100.0 /100 | #38 | Exceptional 22.9% |
| Yaqui | 100.0 /100 | #39 | Exceptional 22.9% |
| Europeans | 100.0 /100 | #40 | Exceptional 22.9% |
| Germans | 100.0 /100 | #41 | Exceptional 22.7% |
| Natives/Alaskans | 100.0 /100 | #42 | Exceptional 22.7% |