South American Indian vs Immigrants from Norway In Labor Force | Age 25-29
COMPARE
South American Indian
Immigrants from Norway
In Labor Force | Age 25-29
In Labor Force | Age 25-29 Comparison
South American Indians
Immigrants from Norway
84.5%
IN LABOR FORCE | AGE 25-29
25.0/ 100
METRIC RATING
193rd/ 347
METRIC RANK
84.6%
IN LABOR FORCE | AGE 25-29
41.9/ 100
METRIC RATING
181st/ 347
METRIC RANK
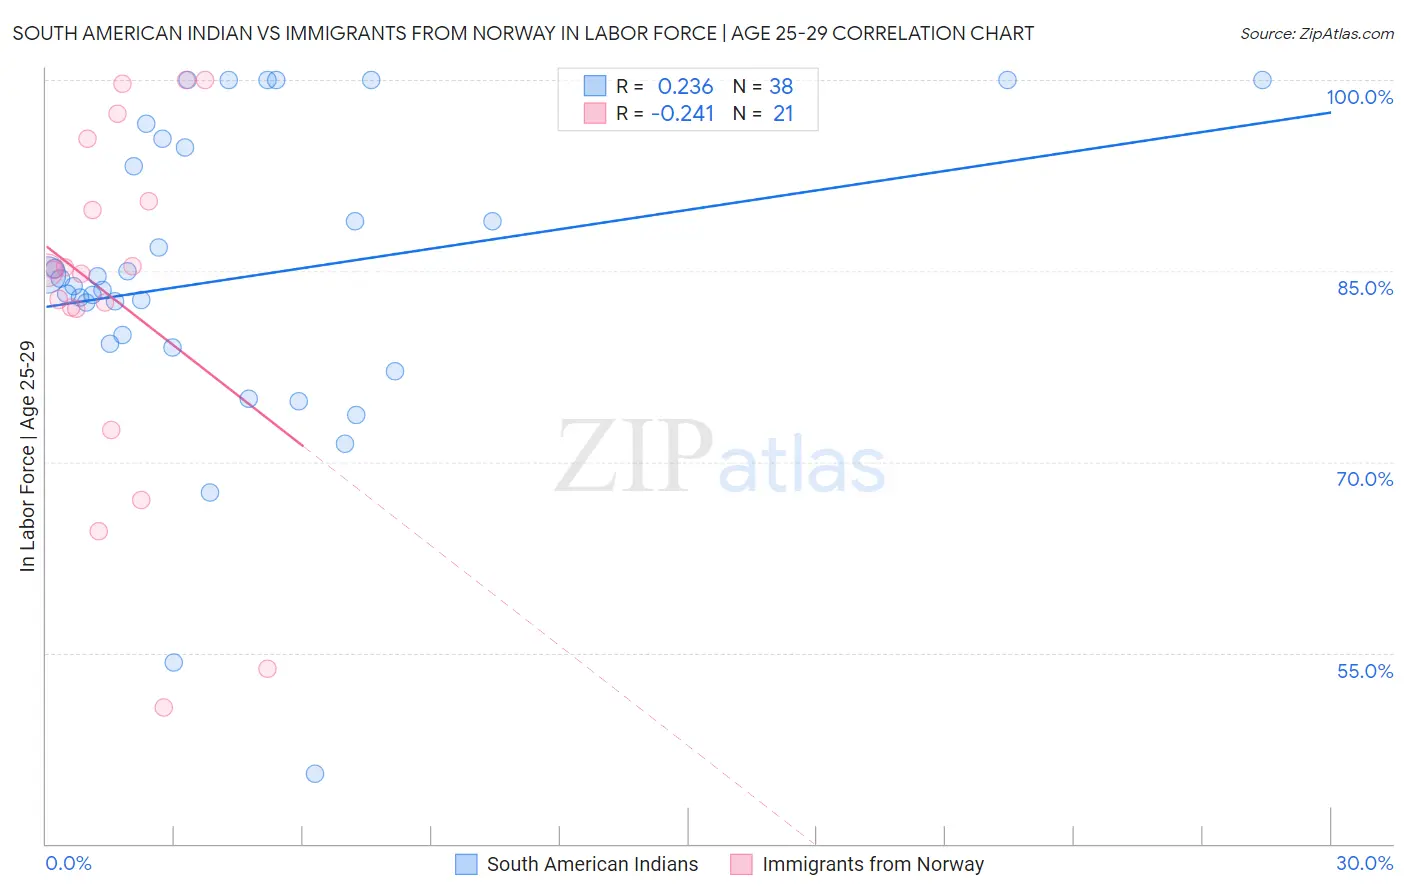
South American Indian vs Immigrants from Norway In Labor Force | Age 25-29 Correlation Chart
The statistical analysis conducted on geographies consisting of 164,547,486 people shows a weak positive correlation between the proportion of South American Indians and labor force participation rate among population between the ages 25 and 29 in the United States with a correlation coefficient (R) of 0.236 and weighted average of 84.5%. Similarly, the statistical analysis conducted on geographies consisting of 116,700,370 people shows a weak negative correlation between the proportion of Immigrants from Norway and labor force participation rate among population between the ages 25 and 29 in the United States with a correlation coefficient (R) of -0.241 and weighted average of 84.6%, a difference of 0.14%.
In Labor Force | Age 25-29 Correlation Summary
| Measurement | South American Indian | Immigrants from Norway |
| Minimum | 45.5% | 50.7% |
| Maximum | 100.0% | 100.0% |
| Range | 54.5% | 49.3% |
| Mean | 84.5% | 82.7% |
| Median | 84.1% | 85.1% |
| Interquartile 25% (IQ1) | 79.3% | 77.2% |
| Interquartile 75% (IQ3) | 94.7% | 92.9% |
| Interquartile Range (IQR) | 15.4% | 15.7% |
| Standard Deviation (Sample) | 12.2% | 14.1% |
| Standard Deviation (Population) | 12.0% | 13.7% |
Demographics Similar to South American Indians and Immigrants from Norway by In Labor Force | Age 25-29
In terms of in labor force | age 25-29, the demographic groups most similar to South American Indians are English (84.5%, a difference of 0.010%), Zimbabwean (84.5%, a difference of 0.030%), Portuguese (84.4%, a difference of 0.040%), Immigrants from Israel (84.4%, a difference of 0.040%), and Welsh (84.5%, a difference of 0.060%). Similarly, the demographic groups most similar to Immigrants from Norway are Immigrants from South America (84.6%, a difference of 0.010%), European (84.6%, a difference of 0.010%), Scottish (84.6%, a difference of 0.010%), Immigrants from Argentina (84.6%, a difference of 0.020%), and Immigrants from China (84.6%, a difference of 0.030%).
| Demographics | Rating | Rank | In Labor Force | Age 25-29 |
| Immigrants | China | 45.7 /100 | #177 | Average 84.6% |
| Immigrants | Thailand | 45.2 /100 | #178 | Average 84.6% |
| Immigrants | Argentina | 44.0 /100 | #179 | Average 84.6% |
| Immigrants | South America | 42.9 /100 | #180 | Average 84.6% |
| Immigrants | Norway | 41.9 /100 | #181 | Average 84.6% |
| Europeans | 40.3 /100 | #182 | Average 84.6% |
| Scottish | 40.1 /100 | #183 | Average 84.6% |
| Immigrants | Kuwait | 38.2 /100 | #184 | Fair 84.6% |
| Immigrants | Denmark | 37.0 /100 | #185 | Fair 84.6% |
| Immigrants | Belgium | 35.0 /100 | #186 | Fair 84.6% |
| Immigrants | Portugal | 34.7 /100 | #187 | Fair 84.6% |
| Immigrants | Ukraine | 33.7 /100 | #188 | Fair 84.5% |
| Moroccans | 32.6 /100 | #189 | Fair 84.5% |
| Welsh | 31.1 /100 | #190 | Fair 84.5% |
| Zimbabweans | 28.7 /100 | #191 | Fair 84.5% |
| English | 25.8 /100 | #192 | Fair 84.5% |
| South American Indians | 25.0 /100 | #193 | Fair 84.5% |
| Portuguese | 21.2 /100 | #194 | Fair 84.4% |
| Immigrants | Israel | 20.8 /100 | #195 | Fair 84.4% |
| Immigrants | South Eastern Asia | 19.5 /100 | #196 | Poor 84.4% |
| Tlingit-Haida | 19.3 /100 | #197 | Poor 84.4% |