South African vs Cambodian 2 or more Vehicles in Household
COMPARE
South African
Cambodian
2 or more Vehicles in Household
2 or more Vehicles in Household Comparison
South Africans
Cambodians
56.2%
2 OR MORE VEHICLES IN HOUSEHOLD
83.1/ 100
METRIC RATING
142nd/ 347
METRIC RANK
53.3%
2 OR MORE VEHICLES IN HOUSEHOLD
2.3/ 100
METRIC RATING
239th/ 347
METRIC RANK
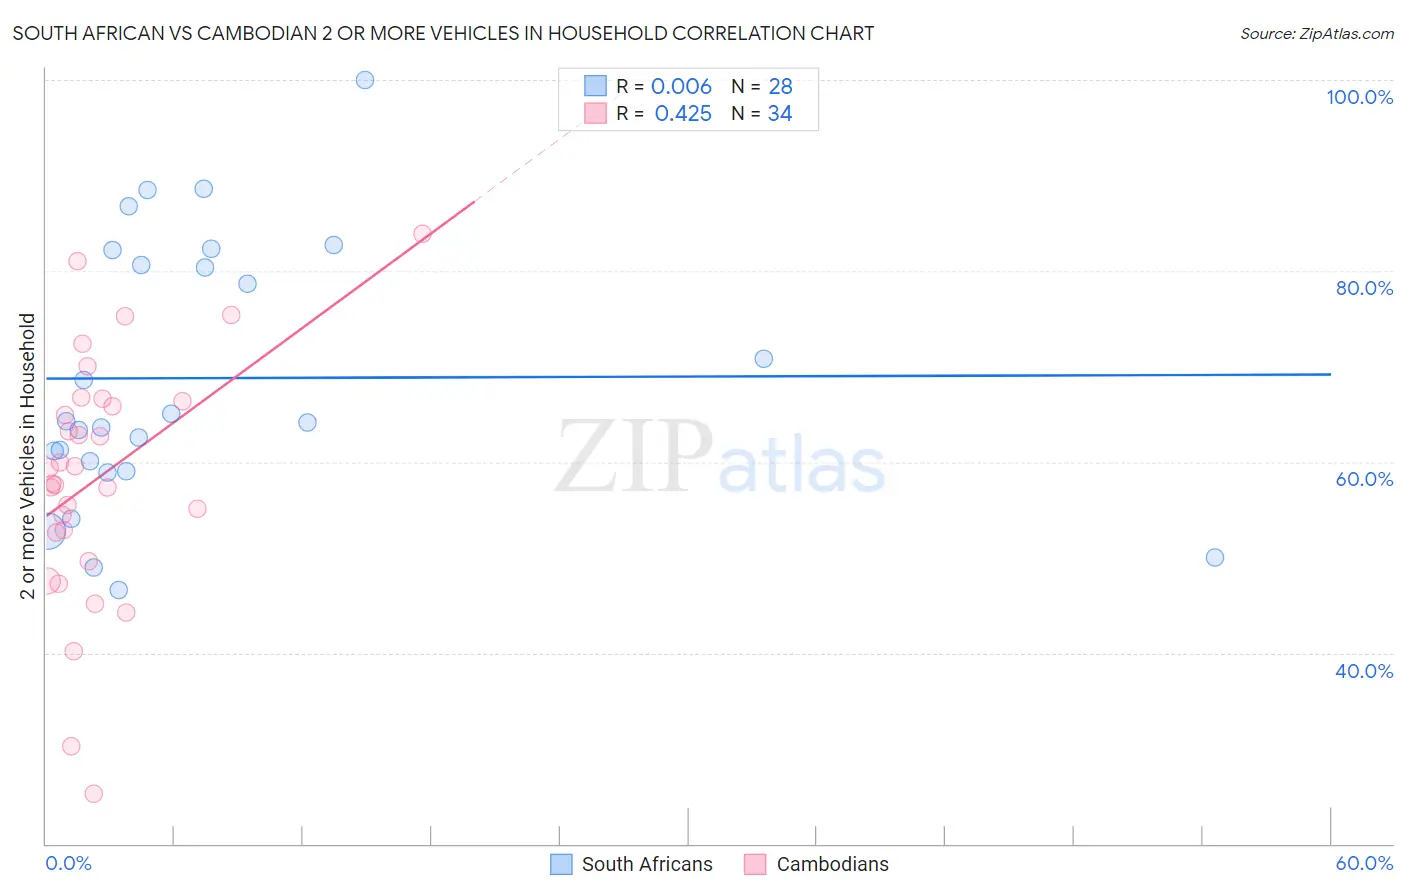
South African vs Cambodian 2 or more Vehicles in Household Correlation Chart
The statistical analysis conducted on geographies consisting of 182,559,953 people shows no correlation between the proportion of South Africans and percentage of households with 2 or more vehicles available in the United States with a correlation coefficient (R) of 0.006 and weighted average of 56.2%. Similarly, the statistical analysis conducted on geographies consisting of 102,491,174 people shows a moderate positive correlation between the proportion of Cambodians and percentage of households with 2 or more vehicles available in the United States with a correlation coefficient (R) of 0.425 and weighted average of 53.3%, a difference of 5.5%.
2 or more Vehicles in Household Correlation Summary
| Measurement | South African | Cambodian |
| Minimum | 46.6% | 25.3% |
| Maximum | 100.0% | 83.9% |
| Range | 53.4% | 58.6% |
| Mean | 68.8% | 58.4% |
| Median | 64.2% | 58.6% |
| Interquartile 25% (IQ1) | 59.5% | 52.7% |
| Interquartile 75% (IQ3) | 81.4% | 66.4% |
| Interquartile Range (IQR) | 21.9% | 13.8% |
| Standard Deviation (Sample) | 14.0% | 12.9% |
| Standard Deviation (Population) | 13.7% | 12.7% |
Similar Demographics by 2 or more Vehicles in Household
Demographics Similar to South Africans by 2 or more Vehicles in Household
In terms of 2 or more vehicles in household, the demographic groups most similar to South Africans are Latvian (56.2%, a difference of 0.040%), Immigrants from Cambodia (56.2%, a difference of 0.040%), Armenian (56.3%, a difference of 0.090%), Seminole (56.2%, a difference of 0.090%), and Immigrants from Syria (56.2%, a difference of 0.11%).
| Demographics | Rating | Rank | 2 or more Vehicles in Household |
| Blackfeet | 86.5 /100 | #135 | Excellent 56.4% |
| Immigrants | Asia | 86.0 /100 | #136 | Excellent 56.3% |
| Cubans | 84.8 /100 | #137 | Excellent 56.3% |
| Salvadorans | 84.7 /100 | #138 | Excellent 56.3% |
| Armenians | 84.3 /100 | #139 | Excellent 56.3% |
| Latvians | 83.6 /100 | #140 | Excellent 56.2% |
| Immigrants | Cambodia | 83.6 /100 | #141 | Excellent 56.2% |
| South Africans | 83.1 /100 | #142 | Excellent 56.2% |
| Seminole | 81.7 /100 | #143 | Excellent 56.2% |
| Immigrants | Syria | 81.4 /100 | #144 | Excellent 56.2% |
| Syrians | 81.2 /100 | #145 | Excellent 56.2% |
| Venezuelans | 80.7 /100 | #146 | Excellent 56.1% |
| Serbians | 80.3 /100 | #147 | Excellent 56.1% |
| Immigrants | Moldova | 80.2 /100 | #148 | Excellent 56.1% |
| Chileans | 80.2 /100 | #149 | Excellent 56.1% |
Demographics Similar to Cambodians by 2 or more Vehicles in Household
In terms of 2 or more vehicles in household, the demographic groups most similar to Cambodians are Immigrants from Armenia (53.3%, a difference of 0.010%), Macedonian (53.3%, a difference of 0.070%), Immigrants from Europe (53.2%, a difference of 0.070%), Immigrants from Sierra Leone (53.2%, a difference of 0.10%), and Immigrants from Eastern Asia (53.2%, a difference of 0.10%).
| Demographics | Rating | Rank | 2 or more Vehicles in Household |
| Immigrants | Guatemala | 3.2 /100 | #232 | Tragic 53.5% |
| Ugandans | 3.2 /100 | #233 | Tragic 53.5% |
| Immigrants | Switzerland | 3.0 /100 | #234 | Tragic 53.4% |
| Immigrants | Middle Africa | 3.0 /100 | #235 | Tragic 53.4% |
| Indonesians | 2.7 /100 | #236 | Tragic 53.4% |
| Macedonians | 2.4 /100 | #237 | Tragic 53.3% |
| Immigrants | Armenia | 2.3 /100 | #238 | Tragic 53.3% |
| Cambodians | 2.3 /100 | #239 | Tragic 53.3% |
| Immigrants | Europe | 2.1 /100 | #240 | Tragic 53.2% |
| Immigrants | Sierra Leone | 2.1 /100 | #241 | Tragic 53.2% |
| Immigrants | Eastern Asia | 2.1 /100 | #242 | Tragic 53.2% |
| Ethiopians | 1.7 /100 | #243 | Tragic 53.1% |
| Indians (Asian) | 1.7 /100 | #244 | Tragic 53.1% |
| Immigrants | Ethiopia | 1.5 /100 | #245 | Tragic 53.0% |
| Immigrants | Nigeria | 1.2 /100 | #246 | Tragic 52.9% |