South African vs Immigrants from Nepal 4 or more Vehicles in Household
COMPARE
South African
Immigrants from Nepal
4 or more Vehicles in Household
4 or more Vehicles in Household Comparison
South Africans
Immigrants from Nepal
6.2%
4 OR MORE VEHICLES IN HOUSEHOLD
32.2/ 100
METRIC RATING
190th/ 347
METRIC RANK
5.6%
4 OR MORE VEHICLES IN HOUSEHOLD
0.9/ 100
METRIC RATING
266th/ 347
METRIC RANK
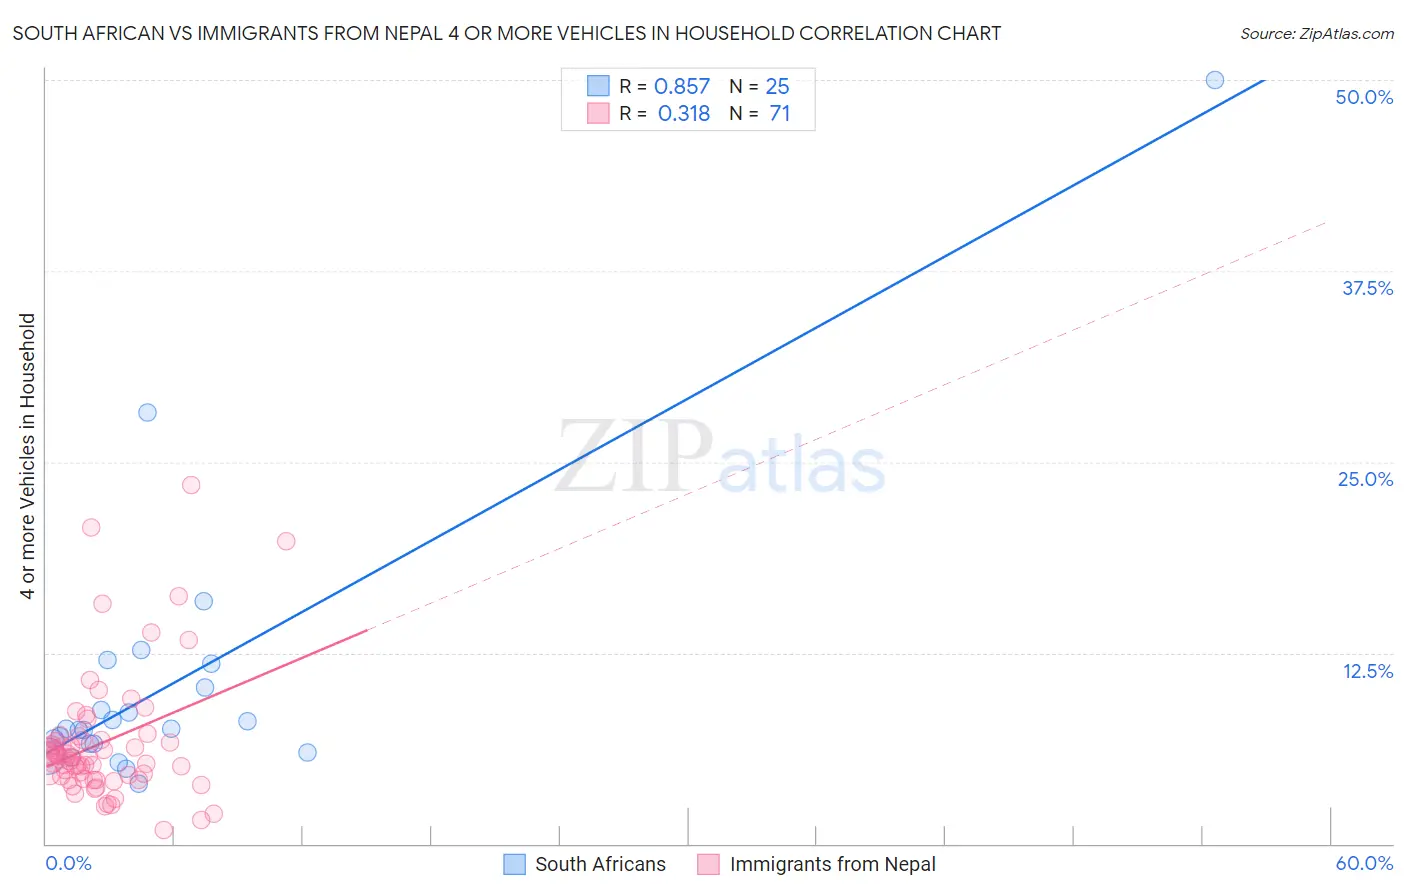
South African vs Immigrants from Nepal 4 or more Vehicles in Household Correlation Chart
The statistical analysis conducted on geographies consisting of 181,747,676 people shows a very strong positive correlation between the proportion of South Africans and percentage of households with 4 or more vehicles available in the United States with a correlation coefficient (R) of 0.857 and weighted average of 6.2%. Similarly, the statistical analysis conducted on geographies consisting of 186,146,815 people shows a mild positive correlation between the proportion of Immigrants from Nepal and percentage of households with 4 or more vehicles available in the United States with a correlation coefficient (R) of 0.318 and weighted average of 5.6%, a difference of 11.5%.
4 or more Vehicles in Household Correlation Summary
| Measurement | South African | Immigrants from Nepal |
| Minimum | 3.9% | 0.91% |
| Maximum | 50.0% | 23.5% |
| Range | 46.1% | 22.6% |
| Mean | 10.5% | 6.6% |
| Median | 7.5% | 5.7% |
| Interquartile 25% (IQ1) | 6.2% | 4.2% |
| Interquartile 75% (IQ3) | 11.0% | 6.8% |
| Interquartile Range (IQR) | 4.8% | 2.6% |
| Standard Deviation (Sample) | 9.6% | 4.2% |
| Standard Deviation (Population) | 9.4% | 4.2% |
Similar Demographics by 4 or more Vehicles in Household
Demographics Similar to South Africans by 4 or more Vehicles in Household
In terms of 4 or more vehicles in household, the demographic groups most similar to South Africans are Immigrants from Eastern Asia (6.2%, a difference of 0.12%), Inupiat (6.2%, a difference of 0.18%), Romanian (6.2%, a difference of 0.19%), Kiowa (6.2%, a difference of 0.29%), and Immigrants from South Africa (6.2%, a difference of 0.36%).
| Demographics | Rating | Rank | 4 or more Vehicles in Household |
| Immigrants | Burma/Myanmar | 37.5 /100 | #183 | Fair 6.2% |
| Iraqis | 37.3 /100 | #184 | Fair 6.2% |
| Thais | 36.9 /100 | #185 | Fair 6.2% |
| Immigrants | Northern Europe | 36.8 /100 | #186 | Fair 6.2% |
| Immigrants | South Africa | 35.4 /100 | #187 | Fair 6.2% |
| Kiowa | 34.7 /100 | #188 | Fair 6.2% |
| Immigrants | Eastern Asia | 33.3 /100 | #189 | Fair 6.2% |
| South Africans | 32.2 /100 | #190 | Fair 6.2% |
| Inupiat | 30.7 /100 | #191 | Fair 6.2% |
| Romanians | 30.7 /100 | #192 | Fair 6.2% |
| Immigrants | Kuwait | 28.0 /100 | #193 | Fair 6.2% |
| Immigrants | Sweden | 27.0 /100 | #194 | Fair 6.2% |
| Argentineans | 27.0 /100 | #195 | Fair 6.2% |
| Tsimshian | 26.4 /100 | #196 | Fair 6.2% |
| Immigrants | Sri Lanka | 23.7 /100 | #197 | Fair 6.1% |
Demographics Similar to Immigrants from Nepal by 4 or more Vehicles in Household
In terms of 4 or more vehicles in household, the demographic groups most similar to Immigrants from Nepal are South American (5.6%, a difference of 0.020%), Immigrants from Ukraine (5.6%, a difference of 0.080%), Immigrants from Africa (5.6%, a difference of 0.24%), Colombian (5.5%, a difference of 0.51%), and Carpatho Rusyn (5.5%, a difference of 0.67%).
| Demographics | Rating | Rank | 4 or more Vehicles in Household |
| Immigrants | France | 1.3 /100 | #259 | Tragic 5.6% |
| Uruguayans | 1.3 /100 | #260 | Tragic 5.6% |
| Sudanese | 1.2 /100 | #261 | Tragic 5.6% |
| Bermudans | 1.2 /100 | #262 | Tragic 5.6% |
| Immigrants | Saudi Arabia | 1.1 /100 | #263 | Tragic 5.6% |
| Immigrants | Africa | 1.0 /100 | #264 | Tragic 5.6% |
| South Americans | 0.9 /100 | #265 | Tragic 5.6% |
| Immigrants | Nepal | 0.9 /100 | #266 | Tragic 5.6% |
| Immigrants | Ukraine | 0.9 /100 | #267 | Tragic 5.6% |
| Colombians | 0.7 /100 | #268 | Tragic 5.5% |
| Carpatho Rusyns | 0.7 /100 | #269 | Tragic 5.5% |
| Okinawans | 0.6 /100 | #270 | Tragic 5.5% |
| Immigrants | Sudan | 0.6 /100 | #271 | Tragic 5.5% |
| Immigrants | Kazakhstan | 0.6 /100 | #272 | Tragic 5.5% |
| Macedonians | 0.6 /100 | #273 | Tragic 5.5% |