South African vs Immigrants from Nepal Cognitive Disability
COMPARE
South African
Immigrants from Nepal
Cognitive Disability
Cognitive Disability Comparison
South Africans
Immigrants from Nepal
16.9%
COGNITIVE DISABILITY
95.5/ 100
METRIC RATING
119th/ 347
METRIC RANK
18.0%
COGNITIVE DISABILITY
0.2/ 100
METRIC RATING
273rd/ 347
METRIC RANK
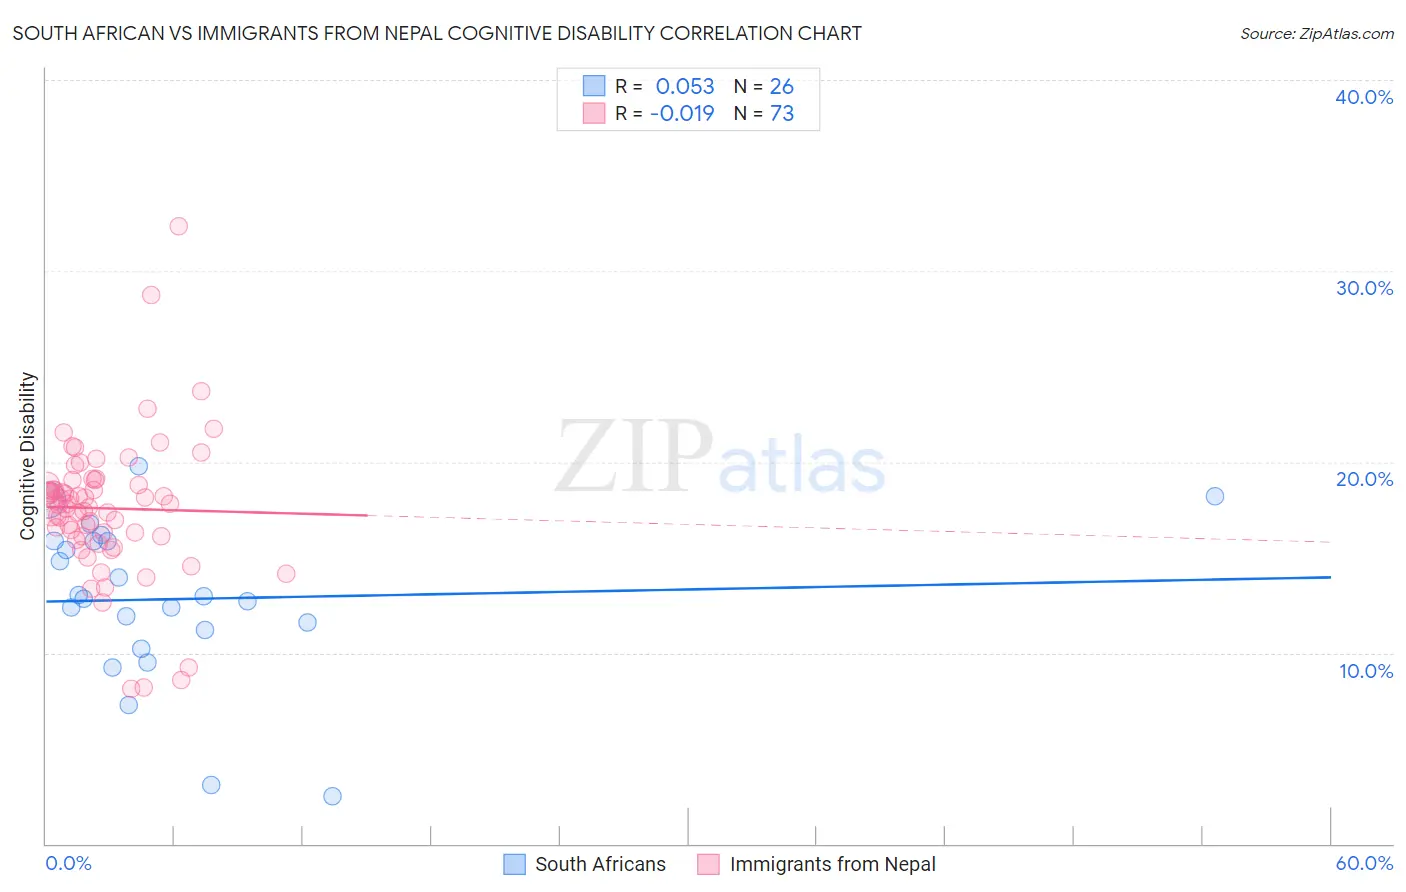
South African vs Immigrants from Nepal Cognitive Disability Correlation Chart
The statistical analysis conducted on geographies consisting of 182,593,753 people shows a slight positive correlation between the proportion of South Africans and percentage of population with cognitive disability in the United States with a correlation coefficient (R) of 0.053 and weighted average of 16.9%. Similarly, the statistical analysis conducted on geographies consisting of 186,780,805 people shows no correlation between the proportion of Immigrants from Nepal and percentage of population with cognitive disability in the United States with a correlation coefficient (R) of -0.019 and weighted average of 18.0%, a difference of 6.8%.
Cognitive Disability Correlation Summary
| Measurement | South African | Immigrants from Nepal |
| Minimum | 2.5% | 8.1% |
| Maximum | 19.8% | 32.3% |
| Range | 17.3% | 24.2% |
| Mean | 12.8% | 17.6% |
| Median | 12.9% | 17.8% |
| Interquartile 25% (IQ1) | 11.2% | 16.1% |
| Interquartile 75% (IQ3) | 15.8% | 18.9% |
| Interquartile Range (IQR) | 4.7% | 2.8% |
| Standard Deviation (Sample) | 4.2% | 3.7% |
| Standard Deviation (Population) | 4.1% | 3.7% |
Similar Demographics by Cognitive Disability
Demographics Similar to South Africans by Cognitive Disability
In terms of cognitive disability, the demographic groups most similar to South Africans are Scottish (16.9%, a difference of 0.080%), Immigrants from China (16.9%, a difference of 0.10%), Immigrants from Western Europe (16.9%, a difference of 0.12%), Immigrants from Japan (16.9%, a difference of 0.13%), and Immigrants from Denmark (16.9%, a difference of 0.13%).
| Demographics | Rating | Rank | Cognitive Disability |
| Indians (Asian) | 97.2 /100 | #112 | Exceptional 16.8% |
| Immigrants | Sri Lanka | 97.1 /100 | #113 | Exceptional 16.8% |
| Koreans | 97.1 /100 | #114 | Exceptional 16.8% |
| Yup'ik | 96.9 /100 | #115 | Exceptional 16.9% |
| Inupiat | 96.5 /100 | #116 | Exceptional 16.9% |
| Immigrants | Japan | 96.2 /100 | #117 | Exceptional 16.9% |
| Immigrants | Denmark | 96.2 /100 | #118 | Exceptional 16.9% |
| South Africans | 95.5 /100 | #119 | Exceptional 16.9% |
| Scottish | 95.0 /100 | #120 | Exceptional 16.9% |
| Immigrants | China | 94.9 /100 | #121 | Exceptional 16.9% |
| Immigrants | Western Europe | 94.8 /100 | #122 | Exceptional 16.9% |
| Portuguese | 94.7 /100 | #123 | Exceptional 16.9% |
| Turks | 94.5 /100 | #124 | Exceptional 16.9% |
| Scandinavians | 94.1 /100 | #125 | Exceptional 16.9% |
| Europeans | 93.4 /100 | #126 | Exceptional 17.0% |
Demographics Similar to Immigrants from Nepal by Cognitive Disability
In terms of cognitive disability, the demographic groups most similar to Immigrants from Nepal are Immigrants from Nigeria (18.0%, a difference of 0.010%), Immigrants from Laos (18.1%, a difference of 0.11%), Immigrants from Honduras (18.0%, a difference of 0.12%), Potawatomi (18.0%, a difference of 0.13%), and Yuman (18.1%, a difference of 0.15%).
| Demographics | Rating | Rank | Cognitive Disability |
| Belizeans | 0.4 /100 | #266 | Tragic 18.0% |
| Nepalese | 0.3 /100 | #267 | Tragic 18.0% |
| Cherokee | 0.3 /100 | #268 | Tragic 18.0% |
| Hondurans | 0.3 /100 | #269 | Tragic 18.0% |
| Immigrants | Bahamas | 0.3 /100 | #270 | Tragic 18.0% |
| Potawatomi | 0.2 /100 | #271 | Tragic 18.0% |
| Immigrants | Honduras | 0.2 /100 | #272 | Tragic 18.0% |
| Immigrants | Nepal | 0.2 /100 | #273 | Tragic 18.0% |
| Immigrants | Nigeria | 0.2 /100 | #274 | Tragic 18.0% |
| Immigrants | Laos | 0.2 /100 | #275 | Tragic 18.1% |
| Yuman | 0.2 /100 | #276 | Tragic 18.1% |
| Immigrants | Kuwait | 0.2 /100 | #277 | Tragic 18.1% |
| Immigrants | Micronesia | 0.2 /100 | #278 | Tragic 18.1% |
| Chippewa | 0.1 /100 | #279 | Tragic 18.1% |
| West Indians | 0.1 /100 | #280 | Tragic 18.1% |