Belizean vs Immigrants from Nepal 4 or more Vehicles in Household
COMPARE
Belizean
Immigrants from Nepal
4 or more Vehicles in Household
4 or more Vehicles in Household Comparison
Belizeans
Immigrants from Nepal
6.3%
4 OR MORE VEHICLES IN HOUSEHOLD
44.5/ 100
METRIC RATING
178th/ 347
METRIC RANK
5.6%
4 OR MORE VEHICLES IN HOUSEHOLD
0.9/ 100
METRIC RATING
266th/ 347
METRIC RANK
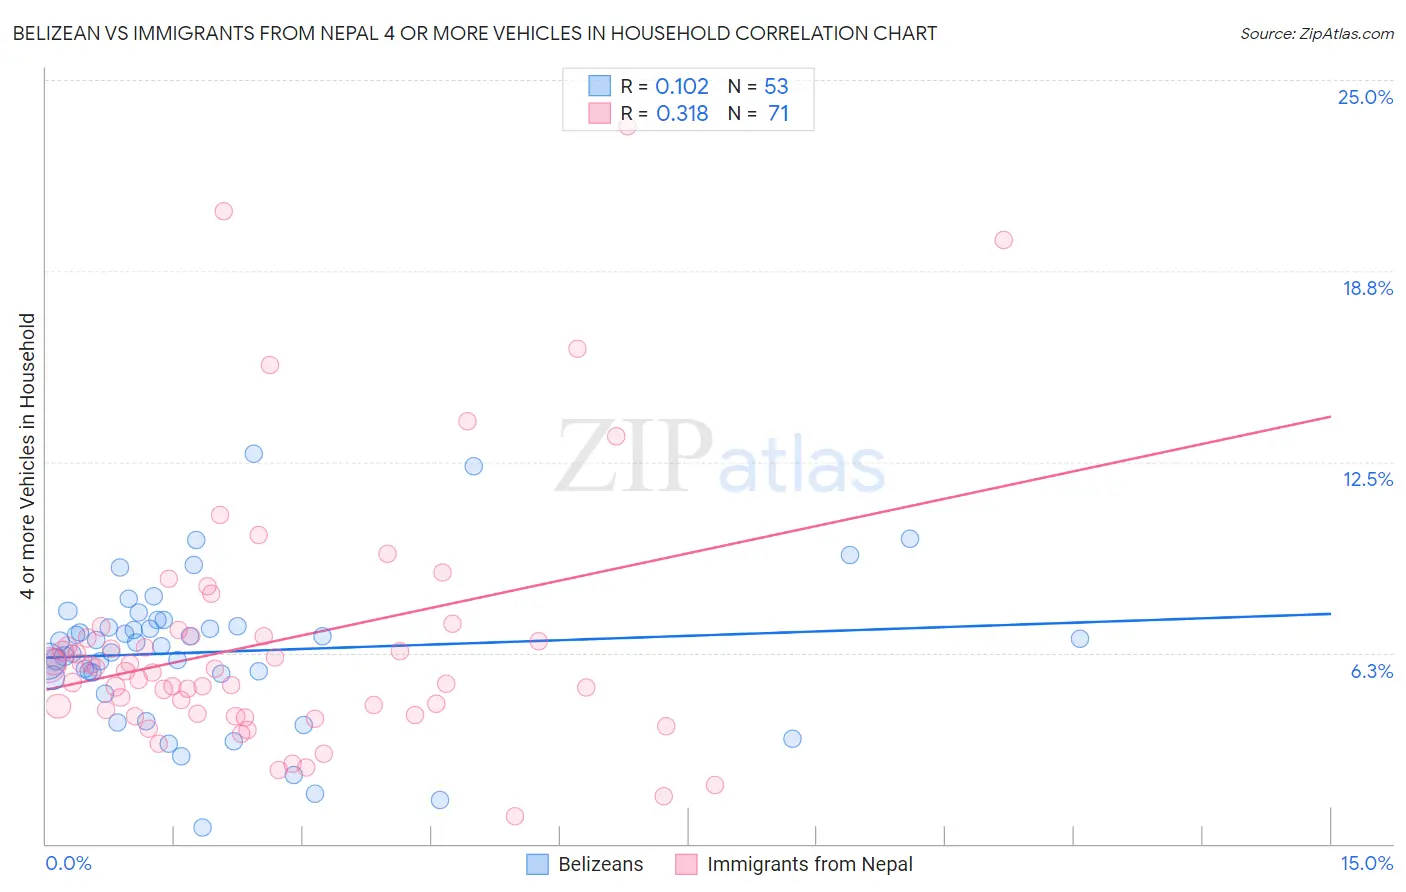
Belizean vs Immigrants from Nepal 4 or more Vehicles in Household Correlation Chart
The statistical analysis conducted on geographies consisting of 143,595,749 people shows a poor positive correlation between the proportion of Belizeans and percentage of households with 4 or more vehicles available in the United States with a correlation coefficient (R) of 0.102 and weighted average of 6.3%. Similarly, the statistical analysis conducted on geographies consisting of 186,146,815 people shows a mild positive correlation between the proportion of Immigrants from Nepal and percentage of households with 4 or more vehicles available in the United States with a correlation coefficient (R) of 0.318 and weighted average of 5.6%, a difference of 13.0%.
4 or more Vehicles in Household Correlation Summary
| Measurement | Belizean | Immigrants from Nepal |
| Minimum | 0.54% | 0.91% |
| Maximum | 12.8% | 23.5% |
| Range | 12.2% | 22.6% |
| Mean | 6.3% | 6.6% |
| Median | 6.6% | 5.7% |
| Interquartile 25% (IQ1) | 5.5% | 4.2% |
| Interquartile 75% (IQ3) | 7.2% | 6.8% |
| Interquartile Range (IQR) | 1.7% | 2.6% |
| Standard Deviation (Sample) | 2.4% | 4.2% |
| Standard Deviation (Population) | 2.4% | 4.2% |
Similar Demographics by 4 or more Vehicles in Household
Demographics Similar to Belizeans by 4 or more Vehicles in Household
In terms of 4 or more vehicles in household, the demographic groups most similar to Belizeans are Immigrants from Japan (6.3%, a difference of 0.15%), Slovak (6.3%, a difference of 0.24%), Syrian (6.3%, a difference of 0.27%), Ukrainian (6.3%, a difference of 0.31%), and Yugoslavian (6.3%, a difference of 0.35%).
| Demographics | Rating | Rank | 4 or more Vehicles in Household |
| Immigrants | India | 51.9 /100 | #171 | Average 6.3% |
| Immigrants | Lebanon | 51.7 /100 | #172 | Average 6.3% |
| Slovenes | 51.1 /100 | #173 | Average 6.3% |
| Lithuanians | 50.0 /100 | #174 | Average 6.3% |
| Immigrants | Western Europe | 48.8 /100 | #175 | Average 6.3% |
| Ukrainians | 47.6 /100 | #176 | Average 6.3% |
| Slovaks | 46.9 /100 | #177 | Average 6.3% |
| Belizeans | 44.5 /100 | #178 | Average 6.3% |
| Immigrants | Japan | 43.1 /100 | #179 | Average 6.3% |
| Syrians | 42.0 /100 | #180 | Average 6.3% |
| Yugoslavians | 41.1 /100 | #181 | Average 6.3% |
| South American Indians | 40.7 /100 | #182 | Average 6.3% |
| Immigrants | Burma/Myanmar | 37.5 /100 | #183 | Fair 6.2% |
| Iraqis | 37.3 /100 | #184 | Fair 6.2% |
| Thais | 36.9 /100 | #185 | Fair 6.2% |
Demographics Similar to Immigrants from Nepal by 4 or more Vehicles in Household
In terms of 4 or more vehicles in household, the demographic groups most similar to Immigrants from Nepal are South American (5.6%, a difference of 0.020%), Immigrants from Ukraine (5.6%, a difference of 0.080%), Immigrants from Africa (5.6%, a difference of 0.24%), Colombian (5.5%, a difference of 0.51%), and Carpatho Rusyn (5.5%, a difference of 0.67%).
| Demographics | Rating | Rank | 4 or more Vehicles in Household |
| Immigrants | France | 1.3 /100 | #259 | Tragic 5.6% |
| Uruguayans | 1.3 /100 | #260 | Tragic 5.6% |
| Sudanese | 1.2 /100 | #261 | Tragic 5.6% |
| Bermudans | 1.2 /100 | #262 | Tragic 5.6% |
| Immigrants | Saudi Arabia | 1.1 /100 | #263 | Tragic 5.6% |
| Immigrants | Africa | 1.0 /100 | #264 | Tragic 5.6% |
| South Americans | 0.9 /100 | #265 | Tragic 5.6% |
| Immigrants | Nepal | 0.9 /100 | #266 | Tragic 5.6% |
| Immigrants | Ukraine | 0.9 /100 | #267 | Tragic 5.6% |
| Colombians | 0.7 /100 | #268 | Tragic 5.5% |
| Carpatho Rusyns | 0.7 /100 | #269 | Tragic 5.5% |
| Okinawans | 0.6 /100 | #270 | Tragic 5.5% |
| Immigrants | Sudan | 0.6 /100 | #271 | Tragic 5.5% |
| Immigrants | Kazakhstan | 0.6 /100 | #272 | Tragic 5.5% |
| Macedonians | 0.6 /100 | #273 | Tragic 5.5% |