Nicaraguan vs Immigrants from Nepal 4 or more Vehicles in Household
COMPARE
Nicaraguan
Immigrants from Nepal
4 or more Vehicles in Household
4 or more Vehicles in Household Comparison
Nicaraguans
Immigrants from Nepal
7.0%
4 OR MORE VEHICLES IN HOUSEHOLD
98.0/ 100
METRIC RATING
107th/ 347
METRIC RANK
5.6%
4 OR MORE VEHICLES IN HOUSEHOLD
0.9/ 100
METRIC RATING
266th/ 347
METRIC RANK
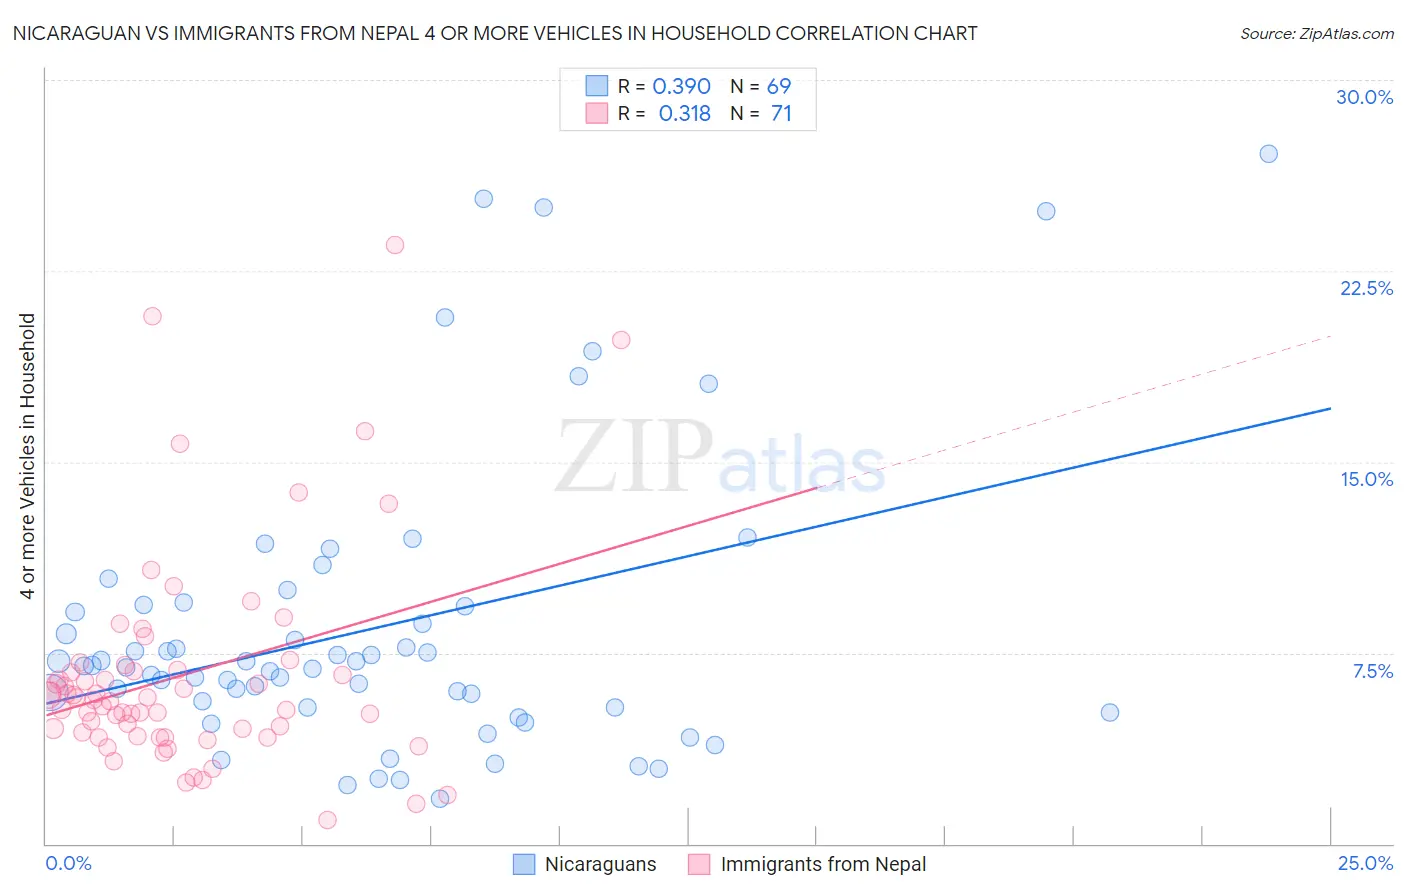
Nicaraguan vs Immigrants from Nepal 4 or more Vehicles in Household Correlation Chart
The statistical analysis conducted on geographies consisting of 284,526,626 people shows a mild positive correlation between the proportion of Nicaraguans and percentage of households with 4 or more vehicles available in the United States with a correlation coefficient (R) of 0.390 and weighted average of 7.0%. Similarly, the statistical analysis conducted on geographies consisting of 186,146,815 people shows a mild positive correlation between the proportion of Immigrants from Nepal and percentage of households with 4 or more vehicles available in the United States with a correlation coefficient (R) of 0.318 and weighted average of 5.6%, a difference of 24.8%.
4 or more Vehicles in Household Correlation Summary
| Measurement | Nicaraguan | Immigrants from Nepal |
| Minimum | 1.8% | 0.91% |
| Maximum | 27.1% | 23.5% |
| Range | 25.3% | 22.6% |
| Mean | 8.5% | 6.6% |
| Median | 7.0% | 5.7% |
| Interquartile 25% (IQ1) | 5.3% | 4.2% |
| Interquartile 75% (IQ3) | 9.4% | 6.8% |
| Interquartile Range (IQR) | 4.0% | 2.6% |
| Standard Deviation (Sample) | 5.7% | 4.2% |
| Standard Deviation (Population) | 5.7% | 4.2% |
Similar Demographics by 4 or more Vehicles in Household
Demographics Similar to Nicaraguans by 4 or more Vehicles in Household
In terms of 4 or more vehicles in household, the demographic groups most similar to Nicaraguans are Guatemalan (7.0%, a difference of 0.010%), French (6.9%, a difference of 0.34%), Hmong (7.0%, a difference of 0.36%), German Russian (7.0%, a difference of 0.36%), and Filipino (6.9%, a difference of 0.52%).
| Demographics | Rating | Rank | 4 or more Vehicles in Household |
| Taiwanese | 98.7 /100 | #100 | Exceptional 7.0% |
| Pakistanis | 98.7 /100 | #101 | Exceptional 7.0% |
| Asians | 98.6 /100 | #102 | Exceptional 7.0% |
| Blackfeet | 98.6 /100 | #103 | Exceptional 7.0% |
| Hmong | 98.3 /100 | #104 | Exceptional 7.0% |
| German Russians | 98.3 /100 | #105 | Exceptional 7.0% |
| Guatemalans | 98.1 /100 | #106 | Exceptional 7.0% |
| Nicaraguans | 98.0 /100 | #107 | Exceptional 7.0% |
| French | 97.7 /100 | #108 | Exceptional 6.9% |
| Filipinos | 97.6 /100 | #109 | Exceptional 6.9% |
| Immigrants | Thailand | 97.0 /100 | #110 | Exceptional 6.9% |
| Aleuts | 97.0 /100 | #111 | Exceptional 6.9% |
| Hopi | 97.0 /100 | #112 | Exceptional 6.9% |
| Canadians | 96.4 /100 | #113 | Exceptional 6.9% |
| Bolivians | 96.3 /100 | #114 | Exceptional 6.8% |
Demographics Similar to Immigrants from Nepal by 4 or more Vehicles in Household
In terms of 4 or more vehicles in household, the demographic groups most similar to Immigrants from Nepal are South American (5.6%, a difference of 0.020%), Immigrants from Ukraine (5.6%, a difference of 0.080%), Immigrants from Africa (5.6%, a difference of 0.24%), Colombian (5.5%, a difference of 0.51%), and Carpatho Rusyn (5.5%, a difference of 0.67%).
| Demographics | Rating | Rank | 4 or more Vehicles in Household |
| Immigrants | France | 1.3 /100 | #259 | Tragic 5.6% |
| Uruguayans | 1.3 /100 | #260 | Tragic 5.6% |
| Sudanese | 1.2 /100 | #261 | Tragic 5.6% |
| Bermudans | 1.2 /100 | #262 | Tragic 5.6% |
| Immigrants | Saudi Arabia | 1.1 /100 | #263 | Tragic 5.6% |
| Immigrants | Africa | 1.0 /100 | #264 | Tragic 5.6% |
| South Americans | 0.9 /100 | #265 | Tragic 5.6% |
| Immigrants | Nepal | 0.9 /100 | #266 | Tragic 5.6% |
| Immigrants | Ukraine | 0.9 /100 | #267 | Tragic 5.6% |
| Colombians | 0.7 /100 | #268 | Tragic 5.5% |
| Carpatho Rusyns | 0.7 /100 | #269 | Tragic 5.5% |
| Okinawans | 0.6 /100 | #270 | Tragic 5.5% |
| Immigrants | Sudan | 0.6 /100 | #271 | Tragic 5.5% |
| Immigrants | Kazakhstan | 0.6 /100 | #272 | Tragic 5.5% |
| Macedonians | 0.6 /100 | #273 | Tragic 5.5% |