South African vs Immigrants from Nepal Associate's Degree
COMPARE
South African
Immigrants from Nepal
Associate's Degree
Associate's Degree Comparison
South Africans
Immigrants from Nepal
51.4%
ASSOCIATE'S DEGREE
99.7/ 100
METRIC RATING
63rd/ 347
METRIC RANK
49.5%
ASSOCIATE'S DEGREE
97.5/ 100
METRIC RATING
100th/ 347
METRIC RANK
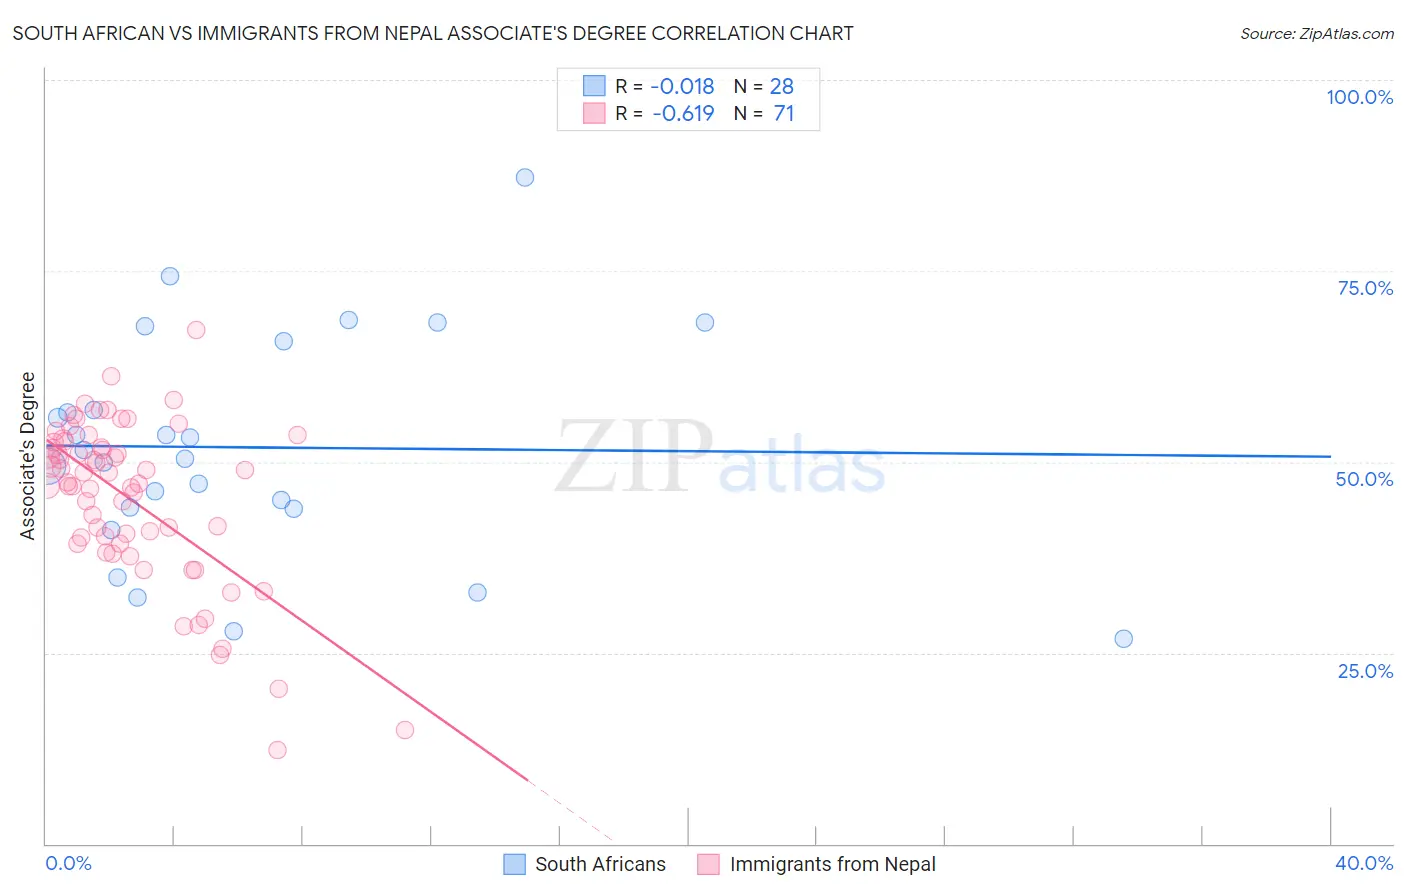
South African vs Immigrants from Nepal Associate's Degree Correlation Chart
The statistical analysis conducted on geographies consisting of 182,596,530 people shows no correlation between the proportion of South Africans and percentage of population with at least associate's degree education in the United States with a correlation coefficient (R) of -0.018 and weighted average of 51.4%. Similarly, the statistical analysis conducted on geographies consisting of 186,769,874 people shows a significant negative correlation between the proportion of Immigrants from Nepal and percentage of population with at least associate's degree education in the United States with a correlation coefficient (R) of -0.619 and weighted average of 49.5%, a difference of 3.7%.
Associate's Degree Correlation Summary
| Measurement | South African | Immigrants from Nepal |
| Minimum | 26.9% | 12.3% |
| Maximum | 87.3% | 67.3% |
| Range | 60.4% | 55.0% |
| Mean | 51.9% | 45.2% |
| Median | 50.9% | 47.3% |
| Interquartile 25% (IQ1) | 44.0% | 39.2% |
| Interquartile 75% (IQ3) | 61.2% | 52.6% |
| Interquartile Range (IQR) | 17.3% | 13.3% |
| Standard Deviation (Sample) | 14.5% | 10.7% |
| Standard Deviation (Population) | 14.2% | 10.6% |
Similar Demographics by Associate's Degree
Demographics Similar to South Africans by Associate's Degree
In terms of associate's degree, the demographic groups most similar to South Africans are Bhutanese (51.4%, a difference of 0.050%), Immigrants from Kazakhstan (51.4%, a difference of 0.060%), Immigrants from Netherlands (51.4%, a difference of 0.070%), Zimbabwean (51.3%, a difference of 0.10%), and Immigrants from Europe (51.3%, a difference of 0.16%).
| Demographics | Rating | Rank | Associate's Degree |
| Immigrants | Czechoslovakia | 99.8 /100 | #56 | Exceptional 51.9% |
| Paraguayans | 99.8 /100 | #57 | Exceptional 51.8% |
| New Zealanders | 99.8 /100 | #58 | Exceptional 51.8% |
| Immigrants | Serbia | 99.8 /100 | #59 | Exceptional 51.7% |
| Immigrants | Bolivia | 99.7 /100 | #60 | Exceptional 51.5% |
| Immigrants | Kazakhstan | 99.7 /100 | #61 | Exceptional 51.4% |
| Bhutanese | 99.7 /100 | #62 | Exceptional 51.4% |
| South Africans | 99.7 /100 | #63 | Exceptional 51.4% |
| Immigrants | Netherlands | 99.7 /100 | #64 | Exceptional 51.4% |
| Zimbabweans | 99.7 /100 | #65 | Exceptional 51.3% |
| Immigrants | Europe | 99.7 /100 | #66 | Exceptional 51.3% |
| Argentineans | 99.6 /100 | #67 | Exceptional 51.2% |
| Immigrants | Indonesia | 99.5 /100 | #68 | Exceptional 51.0% |
| Egyptians | 99.5 /100 | #69 | Exceptional 50.9% |
| Immigrants | Argentina | 99.5 /100 | #70 | Exceptional 50.9% |
Demographics Similar to Immigrants from Nepal by Associate's Degree
In terms of associate's degree, the demographic groups most similar to Immigrants from Nepal are Northern European (49.5%, a difference of 0.16%), Chilean (49.4%, a difference of 0.19%), Macedonian (49.6%, a difference of 0.22%), Immigrants from Northern Africa (49.7%, a difference of 0.28%), and Ukrainian (49.4%, a difference of 0.29%).
| Demographics | Rating | Rank | Associate's Degree |
| Immigrants | Brazil | 98.5 /100 | #93 | Exceptional 50.0% |
| Laotians | 98.4 /100 | #94 | Exceptional 49.9% |
| Immigrants | England | 98.0 /100 | #95 | Exceptional 49.7% |
| Romanians | 98.0 /100 | #96 | Exceptional 49.7% |
| Immigrants | Ukraine | 98.0 /100 | #97 | Exceptional 49.7% |
| Immigrants | Northern Africa | 97.9 /100 | #98 | Exceptional 49.7% |
| Macedonians | 97.8 /100 | #99 | Exceptional 49.6% |
| Immigrants | Nepal | 97.5 /100 | #100 | Exceptional 49.5% |
| Northern Europeans | 97.3 /100 | #101 | Exceptional 49.5% |
| Chileans | 97.3 /100 | #102 | Exceptional 49.4% |
| Ukrainians | 97.1 /100 | #103 | Exceptional 49.4% |
| Venezuelans | 97.0 /100 | #104 | Exceptional 49.4% |
| Croatians | 96.8 /100 | #105 | Exceptional 49.3% |
| Immigrants | Italy | 96.7 /100 | #106 | Exceptional 49.3% |
| Syrians | 96.7 /100 | #107 | Exceptional 49.3% |