South African vs Shoshone 4 or more Vehicles in Household
COMPARE
South African
Shoshone
4 or more Vehicles in Household
4 or more Vehicles in Household Comparison
South Africans
Shoshone
6.2%
4 OR MORE VEHICLES IN HOUSEHOLD
32.2/ 100
METRIC RATING
190th/ 347
METRIC RANK
8.8%
4 OR MORE VEHICLES IN HOUSEHOLD
100.0/ 100
METRIC RATING
15th/ 347
METRIC RANK
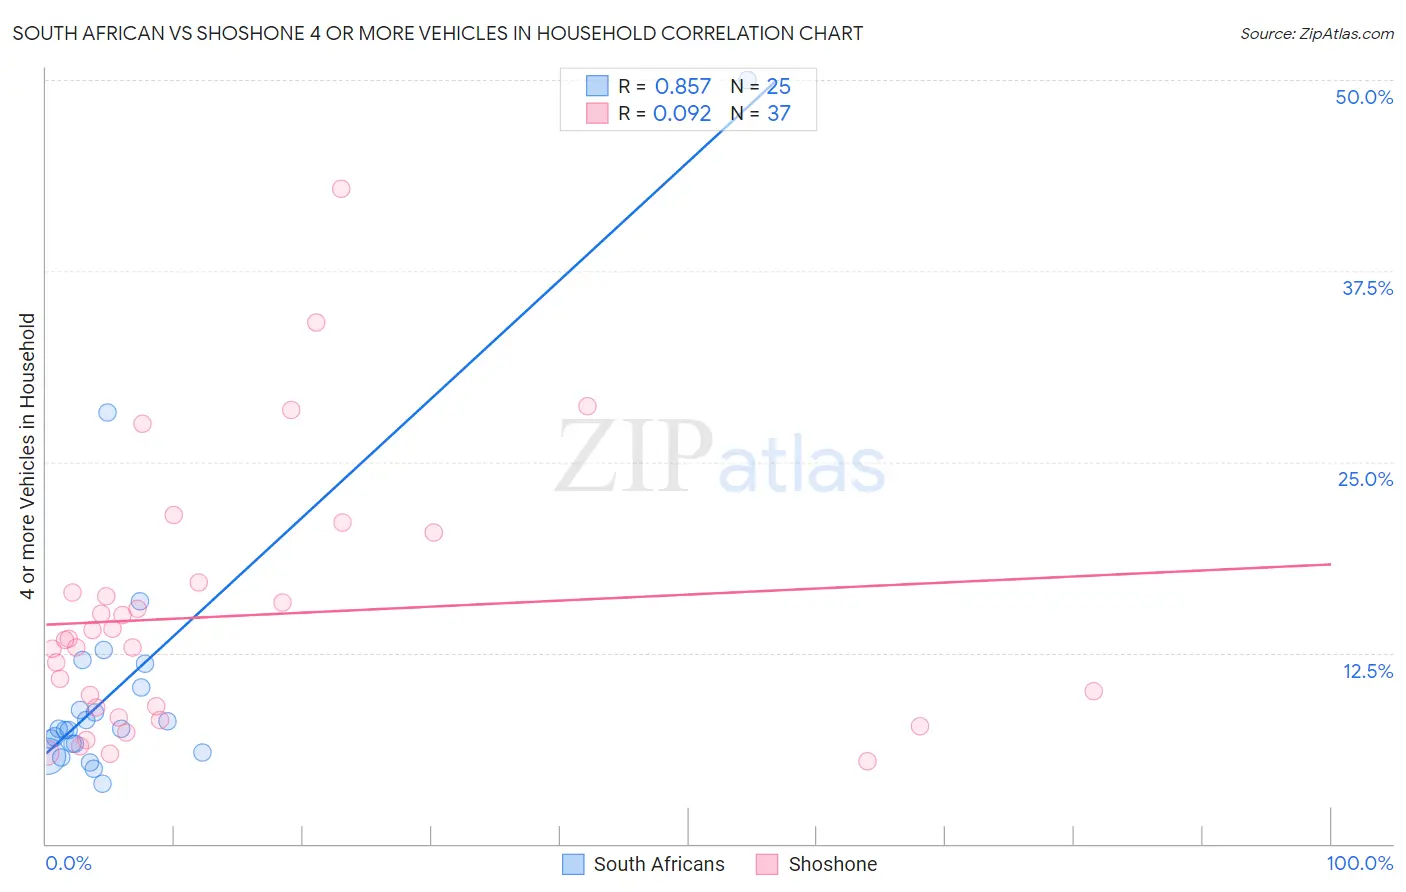
South African vs Shoshone 4 or more Vehicles in Household Correlation Chart
The statistical analysis conducted on geographies consisting of 181,747,676 people shows a very strong positive correlation between the proportion of South Africans and percentage of households with 4 or more vehicles available in the United States with a correlation coefficient (R) of 0.857 and weighted average of 6.2%. Similarly, the statistical analysis conducted on geographies consisting of 66,577,093 people shows a slight positive correlation between the proportion of Shoshone and percentage of households with 4 or more vehicles available in the United States with a correlation coefficient (R) of 0.092 and weighted average of 8.8%, a difference of 42.5%.
4 or more Vehicles in Household Correlation Summary
| Measurement | South African | Shoshone |
| Minimum | 3.9% | 5.4% |
| Maximum | 50.0% | 42.9% |
| Range | 46.1% | 37.5% |
| Mean | 10.5% | 14.9% |
| Median | 7.5% | 13.3% |
| Interquartile 25% (IQ1) | 6.2% | 8.6% |
| Interquartile 75% (IQ3) | 11.0% | 16.8% |
| Interquartile Range (IQR) | 4.8% | 8.2% |
| Standard Deviation (Sample) | 9.6% | 8.4% |
| Standard Deviation (Population) | 9.4% | 8.3% |
Similar Demographics by 4 or more Vehicles in Household
Demographics Similar to South Africans by 4 or more Vehicles in Household
In terms of 4 or more vehicles in household, the demographic groups most similar to South Africans are Immigrants from Eastern Asia (6.2%, a difference of 0.12%), Inupiat (6.2%, a difference of 0.18%), Romanian (6.2%, a difference of 0.19%), Kiowa (6.2%, a difference of 0.29%), and Immigrants from South Africa (6.2%, a difference of 0.36%).
| Demographics | Rating | Rank | 4 or more Vehicles in Household |
| Immigrants | Burma/Myanmar | 37.5 /100 | #183 | Fair 6.2% |
| Iraqis | 37.3 /100 | #184 | Fair 6.2% |
| Thais | 36.9 /100 | #185 | Fair 6.2% |
| Immigrants | Northern Europe | 36.8 /100 | #186 | Fair 6.2% |
| Immigrants | South Africa | 35.4 /100 | #187 | Fair 6.2% |
| Kiowa | 34.7 /100 | #188 | Fair 6.2% |
| Immigrants | Eastern Asia | 33.3 /100 | #189 | Fair 6.2% |
| South Africans | 32.2 /100 | #190 | Fair 6.2% |
| Inupiat | 30.7 /100 | #191 | Fair 6.2% |
| Romanians | 30.7 /100 | #192 | Fair 6.2% |
| Immigrants | Kuwait | 28.0 /100 | #193 | Fair 6.2% |
| Immigrants | Sweden | 27.0 /100 | #194 | Fair 6.2% |
| Argentineans | 27.0 /100 | #195 | Fair 6.2% |
| Tsimshian | 26.4 /100 | #196 | Fair 6.2% |
| Immigrants | Sri Lanka | 23.7 /100 | #197 | Fair 6.1% |
Demographics Similar to Shoshone by 4 or more Vehicles in Household
In terms of 4 or more vehicles in household, the demographic groups most similar to Shoshone are Chinese (8.8%, a difference of 0.030%), Lumbee (8.8%, a difference of 0.71%), Hawaiian (8.9%, a difference of 1.0%), Mexican (8.9%, a difference of 1.0%), and Ute (8.8%, a difference of 1.1%).
| Demographics | Rating | Rank | 4 or more Vehicles in Household |
| Arapaho | 100.0 /100 | #8 | Exceptional 9.4% |
| Samoans | 100.0 /100 | #9 | Exceptional 9.2% |
| Paiute | 100.0 /100 | #10 | Exceptional 9.0% |
| Immigrants | Mexico | 100.0 /100 | #11 | Exceptional 9.0% |
| Mexicans | 100.0 /100 | #12 | Exceptional 8.9% |
| Hawaiians | 100.0 /100 | #13 | Exceptional 8.9% |
| Chinese | 100.0 /100 | #14 | Exceptional 8.8% |
| Shoshone | 100.0 /100 | #15 | Exceptional 8.8% |
| Lumbee | 100.0 /100 | #16 | Exceptional 8.8% |
| Ute | 100.0 /100 | #17 | Exceptional 8.8% |
| Nepalese | 100.0 /100 | #18 | Exceptional 8.7% |
| Koreans | 100.0 /100 | #19 | Exceptional 8.6% |
| Pueblo | 100.0 /100 | #20 | Exceptional 8.6% |
| Danes | 100.0 /100 | #21 | Exceptional 8.6% |
| Immigrants | Vietnam | 100.0 /100 | #22 | Exceptional 8.6% |