South African vs Immigrants from Nepal Master's Degree
COMPARE
South African
Immigrants from Nepal
Master's Degree
Master's Degree Comparison
South Africans
Immigrants from Nepal
18.1%
MASTER'S DEGREE
99.9/ 100
METRIC RATING
64th/ 347
METRIC RANK
17.0%
MASTER'S DEGREE
98.6/ 100
METRIC RATING
101st/ 347
METRIC RANK
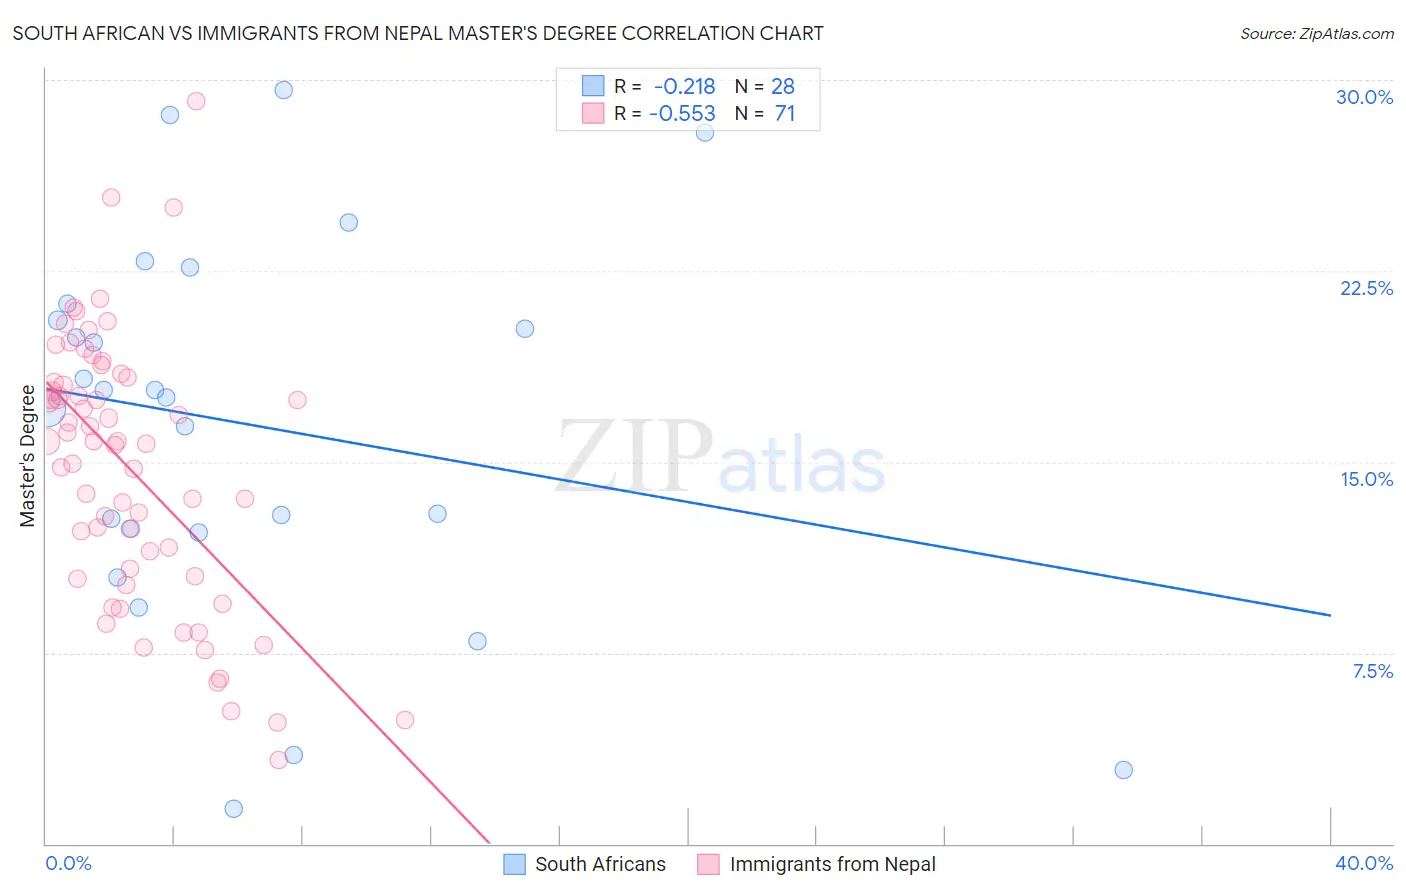
South African vs Immigrants from Nepal Master's Degree Correlation Chart
The statistical analysis conducted on geographies consisting of 182,576,527 people shows a weak negative correlation between the proportion of South Africans and percentage of population with at least master's degree education in the United States with a correlation coefficient (R) of -0.218 and weighted average of 18.1%. Similarly, the statistical analysis conducted on geographies consisting of 186,748,822 people shows a substantial negative correlation between the proportion of Immigrants from Nepal and percentage of population with at least master's degree education in the United States with a correlation coefficient (R) of -0.553 and weighted average of 17.0%, a difference of 6.8%.
Master's Degree Correlation Summary
| Measurement | South African | Immigrants from Nepal |
| Minimum | 1.4% | 3.3% |
| Maximum | 29.6% | 29.2% |
| Range | 28.2% | 25.9% |
| Mean | 16.5% | 14.7% |
| Median | 17.7% | 15.8% |
| Interquartile 25% (IQ1) | 12.3% | 10.5% |
| Interquartile 75% (IQ3) | 20.9% | 18.1% |
| Interquartile Range (IQR) | 8.6% | 7.6% |
| Standard Deviation (Sample) | 7.4% | 5.3% |
| Standard Deviation (Population) | 7.3% | 5.2% |
Similar Demographics by Master's Degree
Demographics Similar to South Africans by Master's Degree
In terms of master's degree, the demographic groups most similar to South Africans are Immigrants from Netherlands (18.1%, a difference of 0.080%), Argentinean (18.2%, a difference of 0.44%), Immigrants from Kazakhstan (18.0%, a difference of 0.70%), Ethiopian (18.0%, a difference of 0.73%), and Immigrants from Argentina (18.0%, a difference of 0.78%).
| Demographics | Rating | Rank | Master's Degree |
| Immigrants | Asia | 99.9 /100 | #57 | Exceptional 18.4% |
| Australians | 99.9 /100 | #58 | Exceptional 18.4% |
| Immigrants | Bulgaria | 99.9 /100 | #59 | Exceptional 18.3% |
| New Zealanders | 99.9 /100 | #60 | Exceptional 18.3% |
| Immigrants | Europe | 99.9 /100 | #61 | Exceptional 18.2% |
| Argentineans | 99.9 /100 | #62 | Exceptional 18.2% |
| Immigrants | Netherlands | 99.9 /100 | #63 | Exceptional 18.1% |
| South Africans | 99.9 /100 | #64 | Exceptional 18.1% |
| Immigrants | Kazakhstan | 99.8 /100 | #65 | Exceptional 18.0% |
| Ethiopians | 99.8 /100 | #66 | Exceptional 18.0% |
| Immigrants | Argentina | 99.8 /100 | #67 | Exceptional 18.0% |
| Immigrants | Ethiopia | 99.8 /100 | #68 | Exceptional 17.9% |
| Immigrants | Uzbekistan | 99.8 /100 | #69 | Exceptional 17.9% |
| Immigrants | Western Europe | 99.8 /100 | #70 | Exceptional 17.8% |
| Immigrants | Pakistan | 99.7 /100 | #71 | Exceptional 17.8% |
Demographics Similar to Immigrants from Nepal by Master's Degree
In terms of master's degree, the demographic groups most similar to Immigrants from Nepal are Chilean (16.9%, a difference of 0.080%), Albanian (17.0%, a difference of 0.18%), Laotian (17.0%, a difference of 0.39%), Alsatian (16.9%, a difference of 0.41%), and Immigrants from Ukraine (17.0%, a difference of 0.45%).
| Demographics | Rating | Rank | Master's Degree |
| Ugandans | 99.0 /100 | #94 | Exceptional 17.1% |
| Immigrants | Morocco | 98.9 /100 | #95 | Exceptional 17.1% |
| Immigrants | Northern Africa | 98.9 /100 | #96 | Exceptional 17.1% |
| Immigrants | England | 98.8 /100 | #97 | Exceptional 17.0% |
| Immigrants | Ukraine | 98.8 /100 | #98 | Exceptional 17.0% |
| Laotians | 98.8 /100 | #99 | Exceptional 17.0% |
| Albanians | 98.7 /100 | #100 | Exceptional 17.0% |
| Immigrants | Nepal | 98.6 /100 | #101 | Exceptional 17.0% |
| Chileans | 98.6 /100 | #102 | Exceptional 16.9% |
| Alsatians | 98.4 /100 | #103 | Exceptional 16.9% |
| Ukrainians | 98.3 /100 | #104 | Exceptional 16.9% |
| Syrians | 98.3 /100 | #105 | Exceptional 16.8% |
| Immigrants | Albania | 98.1 /100 | #106 | Exceptional 16.8% |
| Armenians | 98.0 /100 | #107 | Exceptional 16.8% |
| Sierra Leoneans | 98.0 /100 | #108 | Exceptional 16.8% |