Immigrants from Italy vs Immigrants from Nepal 4 or more Vehicles in Household
COMPARE
Immigrants from Italy
Immigrants from Nepal
4 or more Vehicles in Household
4 or more Vehicles in Household Comparison
Immigrants from Italy
Immigrants from Nepal
6.0%
4 OR MORE VEHICLES IN HOUSEHOLD
11.0/ 100
METRIC RATING
218th/ 347
METRIC RANK
5.6%
4 OR MORE VEHICLES IN HOUSEHOLD
0.9/ 100
METRIC RATING
266th/ 347
METRIC RANK
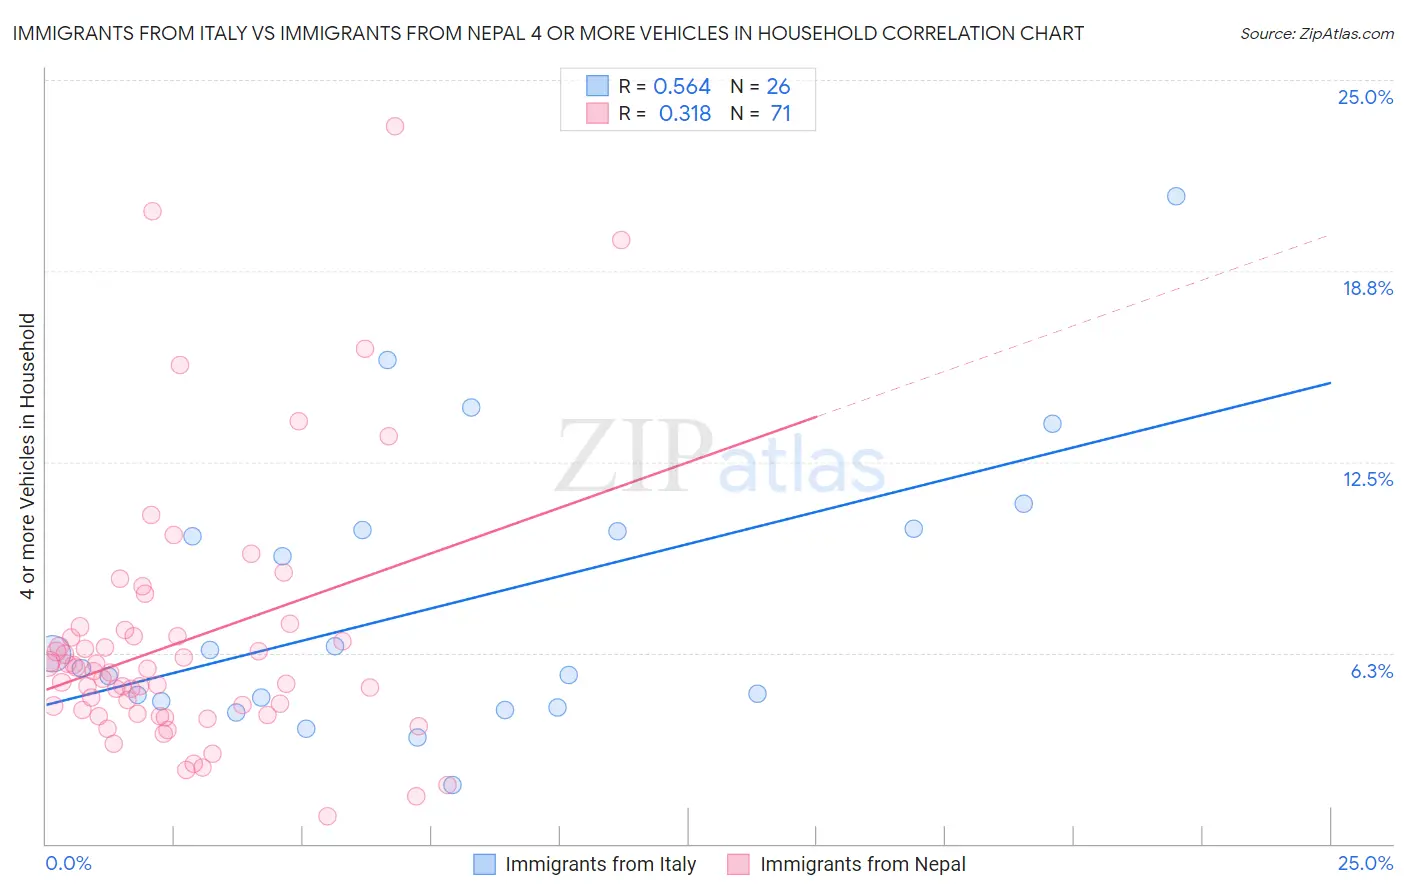
Immigrants from Italy vs Immigrants from Nepal 4 or more Vehicles in Household Correlation Chart
The statistical analysis conducted on geographies consisting of 322,662,886 people shows a substantial positive correlation between the proportion of Immigrants from Italy and percentage of households with 4 or more vehicles available in the United States with a correlation coefficient (R) of 0.564 and weighted average of 6.0%. Similarly, the statistical analysis conducted on geographies consisting of 186,146,815 people shows a mild positive correlation between the proportion of Immigrants from Nepal and percentage of households with 4 or more vehicles available in the United States with a correlation coefficient (R) of 0.318 and weighted average of 5.6%, a difference of 7.6%.
4 or more Vehicles in Household Correlation Summary
| Measurement | Immigrants from Italy | Immigrants from Nepal |
| Minimum | 1.9% | 0.91% |
| Maximum | 21.2% | 23.5% |
| Range | 19.3% | 22.6% |
| Mean | 7.8% | 6.6% |
| Median | 6.0% | 5.7% |
| Interquartile 25% (IQ1) | 4.7% | 4.2% |
| Interquartile 75% (IQ3) | 10.3% | 6.8% |
| Interquartile Range (IQR) | 5.6% | 2.6% |
| Standard Deviation (Sample) | 4.6% | 4.2% |
| Standard Deviation (Population) | 4.5% | 4.2% |
Similar Demographics by 4 or more Vehicles in Household
Demographics Similar to Immigrants from Italy by 4 or more Vehicles in Household
In terms of 4 or more vehicles in household, the demographic groups most similar to Immigrants from Italy are Serbian (6.0%, a difference of 0.0%), Russian (6.0%, a difference of 0.19%), Nigerian (6.0%, a difference of 0.31%), Immigrants from Moldova (6.0%, a difference of 0.49%), and Cajun (6.0%, a difference of 0.52%).
| Demographics | Rating | Rank | 4 or more Vehicles in Household |
| Panamanians | 14.8 /100 | #211 | Poor 6.0% |
| Immigrants | Egypt | 14.7 /100 | #212 | Poor 6.0% |
| Arabs | 14.4 /100 | #213 | Poor 6.0% |
| Immigrants | Austria | 14.3 /100 | #214 | Poor 6.0% |
| Immigrants | China | 13.8 /100 | #215 | Poor 6.0% |
| Immigrants | Romania | 13.8 /100 | #216 | Poor 6.0% |
| Nigerians | 12.2 /100 | #217 | Poor 6.0% |
| Immigrants | Italy | 11.0 /100 | #218 | Poor 6.0% |
| Serbians | 11.0 /100 | #219 | Poor 6.0% |
| Russians | 10.3 /100 | #220 | Poor 6.0% |
| Immigrants | Moldova | 9.3 /100 | #221 | Tragic 6.0% |
| Cajuns | 9.2 /100 | #222 | Tragic 6.0% |
| Immigrants | Kenya | 9.2 /100 | #223 | Tragic 6.0% |
| Cubans | 9.2 /100 | #224 | Tragic 6.0% |
| Indonesians | 8.9 /100 | #225 | Tragic 6.0% |
Demographics Similar to Immigrants from Nepal by 4 or more Vehicles in Household
In terms of 4 or more vehicles in household, the demographic groups most similar to Immigrants from Nepal are South American (5.6%, a difference of 0.020%), Immigrants from Ukraine (5.6%, a difference of 0.080%), Immigrants from Africa (5.6%, a difference of 0.24%), Colombian (5.5%, a difference of 0.51%), and Carpatho Rusyn (5.5%, a difference of 0.67%).
| Demographics | Rating | Rank | 4 or more Vehicles in Household |
| Immigrants | France | 1.3 /100 | #259 | Tragic 5.6% |
| Uruguayans | 1.3 /100 | #260 | Tragic 5.6% |
| Sudanese | 1.2 /100 | #261 | Tragic 5.6% |
| Bermudans | 1.2 /100 | #262 | Tragic 5.6% |
| Immigrants | Saudi Arabia | 1.1 /100 | #263 | Tragic 5.6% |
| Immigrants | Africa | 1.0 /100 | #264 | Tragic 5.6% |
| South Americans | 0.9 /100 | #265 | Tragic 5.6% |
| Immigrants | Nepal | 0.9 /100 | #266 | Tragic 5.6% |
| Immigrants | Ukraine | 0.9 /100 | #267 | Tragic 5.6% |
| Colombians | 0.7 /100 | #268 | Tragic 5.5% |
| Carpatho Rusyns | 0.7 /100 | #269 | Tragic 5.5% |
| Okinawans | 0.6 /100 | #270 | Tragic 5.5% |
| Immigrants | Sudan | 0.6 /100 | #271 | Tragic 5.5% |
| Immigrants | Kazakhstan | 0.6 /100 | #272 | Tragic 5.5% |
| Macedonians | 0.6 /100 | #273 | Tragic 5.5% |