Somali vs Seminole Divorced or Separated
COMPARE
Somali
Seminole
Divorced or Separated
Divorced or Separated Comparison
Somalis
Seminole
12.6%
DIVORCED OR SEPARATED
0.9/ 100
METRIC RATING
253rd/ 347
METRIC RANK
14.3%
DIVORCED OR SEPARATED
0.0/ 100
METRIC RATING
342nd/ 347
METRIC RANK
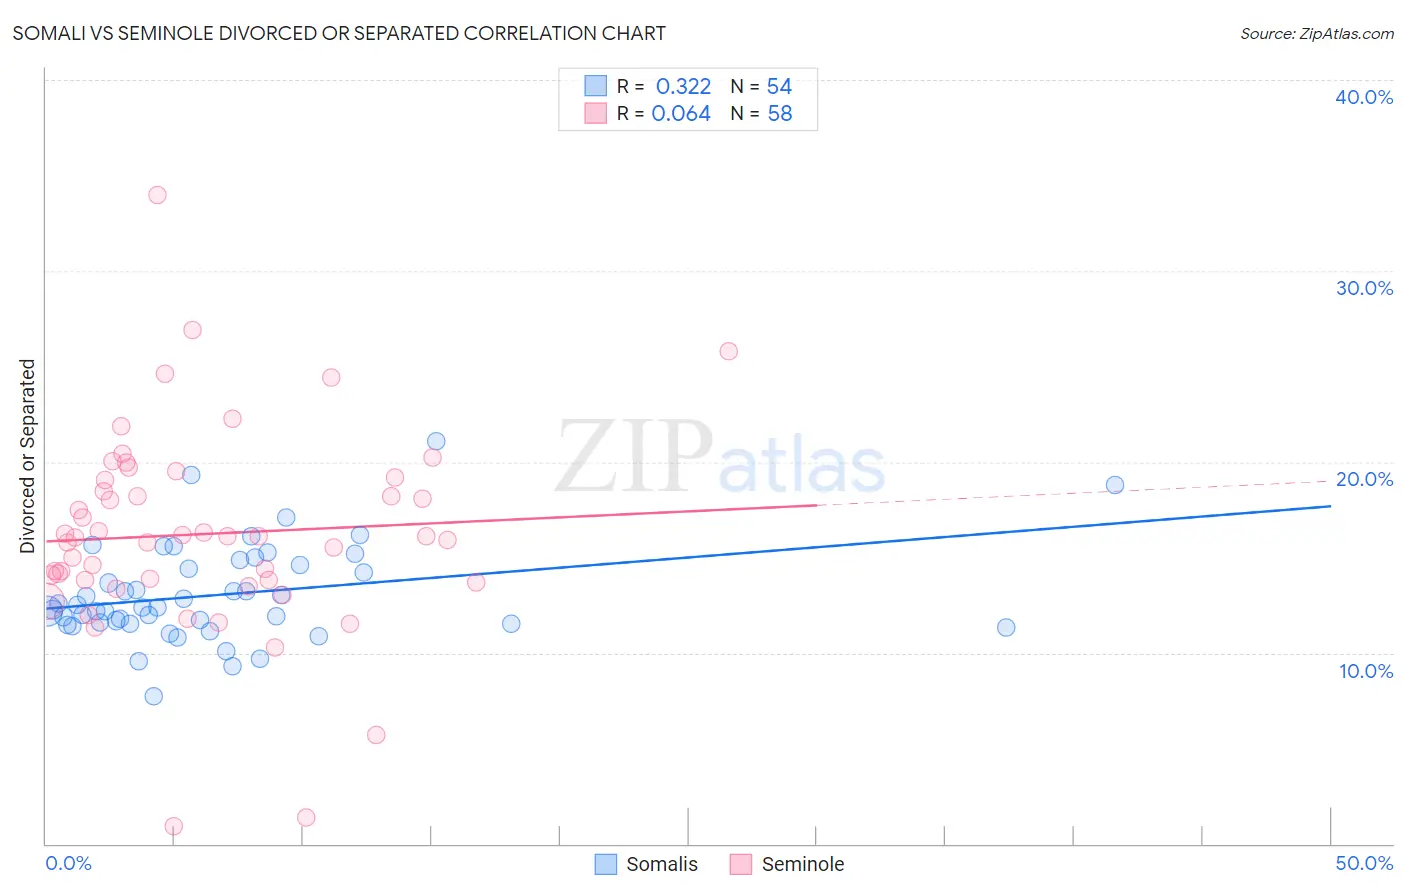
Somali vs Seminole Divorced or Separated Correlation Chart
The statistical analysis conducted on geographies consisting of 99,313,071 people shows a mild positive correlation between the proportion of Somalis and percentage of population currently divorced or separated in the United States with a correlation coefficient (R) of 0.322 and weighted average of 12.6%. Similarly, the statistical analysis conducted on geographies consisting of 118,302,792 people shows a slight positive correlation between the proportion of Seminole and percentage of population currently divorced or separated in the United States with a correlation coefficient (R) of 0.064 and weighted average of 14.3%, a difference of 13.6%.
Divorced or Separated Correlation Summary
| Measurement | Somali | Seminole |
| Minimum | 7.7% | 0.90% |
| Maximum | 21.1% | 34.0% |
| Range | 13.4% | 33.1% |
| Mean | 13.0% | 16.2% |
| Median | 12.4% | 16.1% |
| Interquartile 25% (IQ1) | 11.5% | 13.8% |
| Interquartile 75% (IQ3) | 14.6% | 19.0% |
| Interquartile Range (IQR) | 3.1% | 5.2% |
| Standard Deviation (Sample) | 2.5% | 5.4% |
| Standard Deviation (Population) | 2.5% | 5.3% |
Similar Demographics by Divorced or Separated
Demographics Similar to Somalis by Divorced or Separated
In terms of divorced or separated, the demographic groups most similar to Somalis are Liberian (12.6%, a difference of 0.0%), Senegalese (12.6%, a difference of 0.060%), Welsh (12.6%, a difference of 0.16%), Immigrants from Colombia (12.6%, a difference of 0.31%), and Irish (12.5%, a difference of 0.33%).
| Demographics | Rating | Rank | Divorced or Separated |
| Immigrants | West Indies | 1.9 /100 | #246 | Tragic 12.5% |
| Germans | 1.8 /100 | #247 | Tragic 12.5% |
| Nepalese | 1.8 /100 | #248 | Tragic 12.5% |
| Finns | 1.8 /100 | #249 | Tragic 12.5% |
| Irish | 1.3 /100 | #250 | Tragic 12.5% |
| Aleuts | 1.3 /100 | #251 | Tragic 12.5% |
| Liberians | 0.9 /100 | #252 | Tragic 12.6% |
| Somalis | 0.9 /100 | #253 | Tragic 12.6% |
| Senegalese | 0.8 /100 | #254 | Tragic 12.6% |
| Welsh | 0.7 /100 | #255 | Tragic 12.6% |
| Immigrants | Colombia | 0.6 /100 | #256 | Tragic 12.6% |
| Immigrants | Somalia | 0.6 /100 | #257 | Tragic 12.6% |
| Indonesians | 0.6 /100 | #258 | Tragic 12.6% |
| Yuman | 0.6 /100 | #259 | Tragic 12.6% |
| Immigrants | Uruguay | 0.6 /100 | #260 | Tragic 12.6% |
Demographics Similar to Seminole by Divorced or Separated
In terms of divorced or separated, the demographic groups most similar to Seminole are Bahamian (14.2%, a difference of 0.17%), Chickasaw (14.2%, a difference of 0.36%), Colville (14.2%, a difference of 0.40%), Choctaw (14.1%, a difference of 0.93%), and Creek (14.4%, a difference of 1.1%).
| Demographics | Rating | Rank | Divorced or Separated |
| Puerto Ricans | 0.0 /100 | #333 | Tragic 13.9% |
| Immigrants | Bahamas | 0.0 /100 | #334 | Tragic 13.9% |
| Dutch West Indians | 0.0 /100 | #335 | Tragic 14.0% |
| Shoshone | 0.0 /100 | #336 | Tragic 14.0% |
| Crow | 0.0 /100 | #337 | Tragic 14.1% |
| Choctaw | 0.0 /100 | #338 | Tragic 14.1% |
| Colville | 0.0 /100 | #339 | Tragic 14.2% |
| Chickasaw | 0.0 /100 | #340 | Tragic 14.2% |
| Bahamians | 0.0 /100 | #341 | Tragic 14.2% |
| Seminole | 0.0 /100 | #342 | Tragic 14.3% |
| Creek | 0.0 /100 | #343 | Tragic 14.4% |
| Cubans | 0.0 /100 | #344 | Tragic 14.5% |
| Kiowa | 0.0 /100 | #345 | Tragic 14.5% |
| Arapaho | 0.0 /100 | #346 | Tragic 14.8% |
| Immigrants | Cuba | 0.0 /100 | #347 | Tragic 15.2% |