Slavic vs Mongolian 3 or more Vehicles in Household
COMPARE
Slavic
Mongolian
3 or more Vehicles in Household
3 or more Vehicles in Household Comparison
Slavs
Mongolians
20.4%
3 OR MORE VEHICLES IN HOUSEHOLD
92.1/ 100
METRIC RATING
126th/ 347
METRIC RANK
18.1%
3 OR MORE VEHICLES IN HOUSEHOLD
2.3/ 100
METRIC RATING
244th/ 347
METRIC RANK
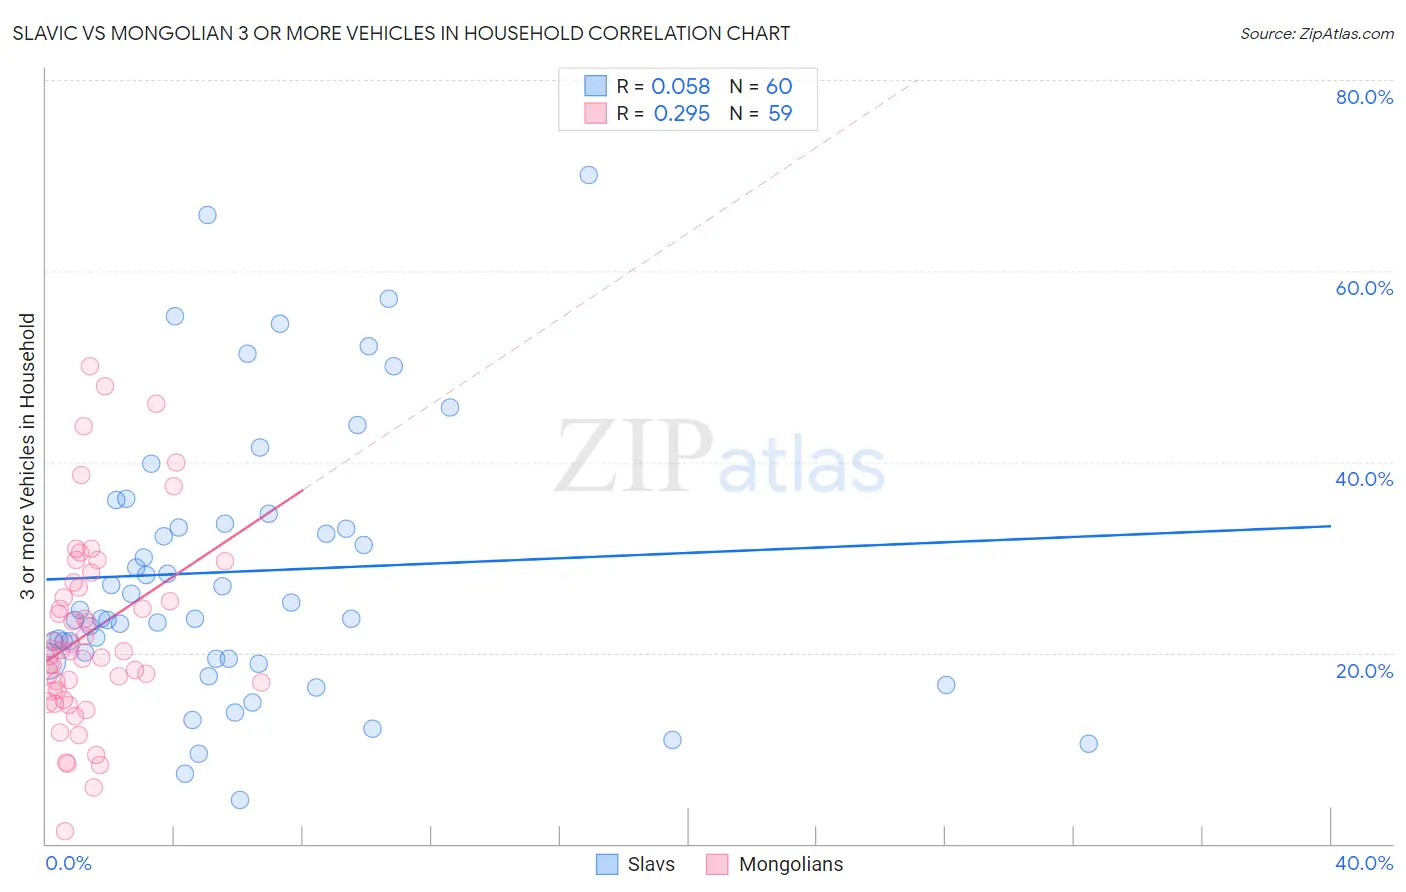
Slavic vs Mongolian 3 or more Vehicles in Household Correlation Chart
The statistical analysis conducted on geographies consisting of 270,770,751 people shows a slight positive correlation between the proportion of Slavs and percentage of households with 3 or more vehicles available in the United States with a correlation coefficient (R) of 0.058 and weighted average of 20.4%. Similarly, the statistical analysis conducted on geographies consisting of 140,244,475 people shows a weak positive correlation between the proportion of Mongolians and percentage of households with 3 or more vehicles available in the United States with a correlation coefficient (R) of 0.295 and weighted average of 18.1%, a difference of 12.7%.
3 or more Vehicles in Household Correlation Summary
| Measurement | Slavic | Mongolian |
| Minimum | 4.6% | 1.4% |
| Maximum | 70.0% | 50.0% |
| Range | 65.4% | 48.6% |
| Mean | 28.5% | 22.2% |
| Median | 24.0% | 20.2% |
| Interquartile 25% (IQ1) | 19.4% | 15.9% |
| Interquartile 75% (IQ3) | 34.0% | 27.4% |
| Interquartile Range (IQR) | 14.6% | 11.5% |
| Standard Deviation (Sample) | 14.4% | 10.3% |
| Standard Deviation (Population) | 14.3% | 10.2% |
Similar Demographics by 3 or more Vehicles in Household
Demographics Similar to Slavs by 3 or more Vehicles in Household
In terms of 3 or more vehicles in household, the demographic groups most similar to Slavs are Immigrants from Bolivia (20.4%, a difference of 0.030%), New Zealander (20.4%, a difference of 0.20%), Immigrants from Netherlands (20.4%, a difference of 0.21%), Central American (20.5%, a difference of 0.24%), and German Russian (20.5%, a difference of 0.42%).
| Demographics | Rating | Rank | 3 or more Vehicles in Household |
| Immigrants | Latin America | 94.5 /100 | #119 | Exceptional 20.5% |
| Maltese | 93.9 /100 | #120 | Exceptional 20.5% |
| Immigrants | Thailand | 93.8 /100 | #121 | Exceptional 20.5% |
| German Russians | 93.7 /100 | #122 | Exceptional 20.5% |
| Immigrants | Korea | 93.7 /100 | #123 | Exceptional 20.5% |
| Central Americans | 93.1 /100 | #124 | Exceptional 20.5% |
| Immigrants | Netherlands | 92.9 /100 | #125 | Exceptional 20.4% |
| Slavs | 92.1 /100 | #126 | Exceptional 20.4% |
| Immigrants | Bolivia | 92.0 /100 | #127 | Exceptional 20.4% |
| New Zealanders | 91.3 /100 | #128 | Exceptional 20.4% |
| Zimbabweans | 88.7 /100 | #129 | Excellent 20.3% |
| Greeks | 88.6 /100 | #130 | Excellent 20.3% |
| Immigrants | Asia | 88.1 /100 | #131 | Excellent 20.2% |
| Immigrants | Canada | 87.8 /100 | #132 | Excellent 20.2% |
| Immigrants | North America | 87.8 /100 | #133 | Excellent 20.2% |
Demographics Similar to Mongolians by 3 or more Vehicles in Household
In terms of 3 or more vehicles in household, the demographic groups most similar to Mongolians are Immigrants from Europe (18.1%, a difference of 0.12%), Immigrants from Belize (18.1%, a difference of 0.16%), Immigrants from Australia (18.1%, a difference of 0.23%), Hopi (18.2%, a difference of 0.24%), and African (18.2%, a difference of 0.35%).
| Demographics | Rating | Rank | 3 or more Vehicles in Household |
| Indonesians | 3.5 /100 | #237 | Tragic 18.3% |
| Immigrants | Honduras | 3.1 /100 | #238 | Tragic 18.2% |
| Immigrants | Middle Africa | 3.1 /100 | #239 | Tragic 18.2% |
| Immigrants | China | 2.9 /100 | #240 | Tragic 18.2% |
| Africans | 2.7 /100 | #241 | Tragic 18.2% |
| Hopi | 2.5 /100 | #242 | Tragic 18.2% |
| Immigrants | Europe | 2.4 /100 | #243 | Tragic 18.1% |
| Mongolians | 2.3 /100 | #244 | Tragic 18.1% |
| Immigrants | Belize | 2.1 /100 | #245 | Tragic 18.1% |
| Immigrants | Australia | 2.0 /100 | #246 | Tragic 18.1% |
| Carpatho Rusyns | 1.9 /100 | #247 | Tragic 18.0% |
| Immigrants | Eastern Africa | 1.8 /100 | #248 | Tragic 18.0% |
| Immigrants | Saudi Arabia | 1.7 /100 | #249 | Tragic 18.0% |
| Venezuelans | 1.7 /100 | #250 | Tragic 18.0% |
| Alsatians | 1.5 /100 | #251 | Tragic 18.0% |