Immigrants from Sweden vs Mongolian 3 or more Vehicles in Household

COMPARE

Immigrants from Sweden
Race
Ancestry
AfghanAfricanAlaska NativeAlaskan AthabascanAlbanianAleutAlsatianAmericanApacheArabArapahoArgentineanArmenianAssyrian/Chaldean/SyriacAustralianAustrianBahamianBangladeshiBarbadianBasqueBelgianBelizeanBermudanBhutaneseBlackfeetBolivianBrazilianBritishBritish West IndianBulgarianBurmeseCajunCambodianCanadianCape VerdeanCarpatho RusynCelticCentral AmericanCentral American IndianCherokeeCheyenneChickasawChileanChineseChippewaChoctawColombianColvilleComancheCosta RicanCreeCreekCroatianCrowCubanCypriotCzechCzechoslovakianDanishDelawareDominicanDutchDutch West IndianEastern EuropeanEcuadorianEgyptianEnglishEstonianEthiopianEuropeanFijianFilipinoFinnishFrenchFrench American IndianFrench CanadianGermanGerman RussianGhanaianGreekGuamanian/ChamorroGuatemalanGuyaneseHaitianHmongHonduranHopiHoumaHungarianIcelanderIndian (Asian)IndonesianInupiatIranianIraqiIrishIroquoisIsraeliItalianJamaicanJapaneseJordanianKenyanKiowaKoreanLaotianLatvianLebaneseLiberianLithuanianLumbeeLuxembourgerMacedonianMalaysianMalteseMarshalleseMenomineeMexicanMexican American IndianMoroccanNative HawaiianNavajoNepaleseNew ZealanderNicaraguanNigerianNorthern EuropeanNorwegianOkinawanOsageOttawaPaiutePakistaniPalestinianPanamanianParaguayanPennsylvania GermanPeruvianPimaPolishPortuguesePotawatomiPuebloPuerto RicanPuget Sound SalishRomanianRussianSalvadoranSamoanScandinavianScotch-IrishScottishSeminoleSenegaleseSerbianShoshoneSierra LeoneanSiouxSlavicSlovakSloveneSomaliSouth AfricanSouth AmericanSouth American IndianSoviet UnionSpaniardSpanishSpanish AmericanSpanish American IndianSri LankanSubsaharan AfricanSudaneseSwedishSwissSyrianTaiwaneseThaiTlingit-HaidaTohono O'OdhamTonganTrinidadian and TobagonianTsimshianTurkishU.S. Virgin IslanderUgandanUkrainianUruguayanUteVenezuelanVietnameseWelshWest IndianYakamaYaquiYugoslavianYumanYup'ikZimbabwean
Immigration
NonimmigrantsImmigrantsAfghanistanAfricaAlbaniaArgentinaArmeniaAsiaAustraliaAustriaBahamasBangladeshBarbadosBelarusBelgiumBelizeBoliviaBosnia and HerzegovinaBrazilBulgariaBurma/MyanmarCabo VerdeCambodiaCameroonCanadaCaribbeanCentral AmericaChileChinaColombiaCongoCosta RicaCroatiaCubaCzechoslovakiaDenmarkDominicaDominican RepublicEastern AfricaEastern AsiaEastern EuropeEcuadorEgyptEl SalvadorEnglandEritreaEthiopiaEuropeFijiFranceGermanyGhanaGreeceGrenadaGuatemalaGuyanaHaitiHondurasHong KongHungaryIndiaIndonesiaIranIraqIrelandIsraelItalyJamaicaJapanJordanKazakhstanKenyaKoreaKuwaitLaosLatin AmericaLatviaLebanonLiberiaLithuaniaMalaysiaMexicoMicronesiaMiddle AfricaMoldovaMoroccoNepalNetherlandsNicaraguaNigeriaNorth AmericaNorth MacedoniaNorthern AfricaNorthern EuropeNorwayOceaniaPakistanPanamaPeruPhilippinesPolandPortugalRomaniaRussiaSaudi ArabiaScotlandSenegalSerbiaSierra LeoneSingaporeSomaliaSouth AfricaSouth AmericaSouth Central AsiaSouth Eastern AsiaSouthern EuropeSpainSri LankaSt. Vincent and the GrenadinesSudanSwedenSwitzerlandSyriaTaiwanThailandTrinidad and TobagoTurkeyUgandaUkraineUruguayUzbekistanVenezuelaVietnamWest IndiesWestern AfricaWestern AsiaWestern EuropeYemenZaireZimbabweAzores
Mongolian
Race
Ancestry
AfghanAfricanAlaska NativeAlaskan AthabascanAlbanianAleutAlsatianAmericanApacheArabArapahoArgentineanArmenianAssyrian/Chaldean/SyriacAustralianAustrianBahamianBangladeshiBarbadianBasqueBelgianBelizeanBermudanBhutaneseBlackfeetBolivianBrazilianBritishBritish West IndianBulgarianBurmeseCajunCambodianCanadianCape VerdeanCarpatho RusynCelticCentral AmericanCentral American IndianCherokeeCheyenneChickasawChileanChineseChippewaChoctawColombianColvilleComancheCosta RicanCreeCreekCroatianCrowCubanCypriotCzechCzechoslovakianDanishDelawareDominicanDutchDutch West IndianEastern EuropeanEcuadorianEgyptianEnglishEstonianEthiopianEuropeanFijianFilipinoFinnishFrenchFrench American IndianFrench CanadianGermanGerman RussianGhanaianGreekGuamanian/ChamorroGuatemalanGuyaneseHaitianHmongHonduranHopiHoumaHungarianIcelanderIndian (Asian)IndonesianInupiatIranianIraqiIrishIroquoisIsraeliItalianJamaicanJapaneseJordanianKenyanKiowaKoreanLaotianLatvianLebaneseLiberianLithuanianLumbeeLuxembourgerMacedonianMalaysianMalteseMarshalleseMenomineeMexicanMexican American IndianMongolianMoroccanNative HawaiianNavajoNepaleseNew ZealanderNicaraguanNigerianNorthern EuropeanNorwegianOkinawanOsageOttawaPaiutePakistaniPalestinianPanamanianParaguayanPennsylvania GermanPeruvianPimaPolishPortuguesePotawatomiPuebloPuerto RicanPuget Sound SalishRomanianRussianSalvadoranSamoanScandinavianScotch-IrishScottishSeminoleSenegaleseSerbianShoshoneSierra LeoneanSiouxSlavicSlovakSloveneSomaliSouth AfricanSouth AmericanSouth American IndianSoviet UnionSpaniardSpanishSpanish AmericanSpanish American IndianSri LankanSubsaharan AfricanSudaneseSwedishSwissSyrianTaiwaneseThaiTlingit-HaidaTohono O'OdhamTonganTrinidadian and TobagonianTsimshianTurkishU.S. Virgin IslanderUgandanUkrainianUruguayanUteVenezuelanVietnameseWelshWest IndianYakamaYaquiYugoslavianYumanYup'ikZimbabwean
Immigration
NonimmigrantsImmigrantsAfghanistanAfricaAlbaniaArgentinaArmeniaAsiaAustraliaAustriaBahamasBangladeshBarbadosBelarusBelgiumBelizeBoliviaBosnia and HerzegovinaBrazilBulgariaBurma/MyanmarCabo VerdeCambodiaCameroonCanadaCaribbeanCentral AmericaChileChinaColombiaCongoCosta RicaCroatiaCubaCzechoslovakiaDenmarkDominicaDominican RepublicEastern AfricaEastern AsiaEastern EuropeEcuadorEgyptEl SalvadorEnglandEritreaEthiopiaEuropeFijiFranceGermanyGhanaGreeceGrenadaGuatemalaGuyanaHaitiHondurasHong KongHungaryIndiaIndonesiaIranIraqIrelandIsraelItalyJamaicaJapanJordanKazakhstanKenyaKoreaKuwaitLaosLatin AmericaLatviaLebanonLiberiaLithuaniaMalaysiaMexicoMicronesiaMiddle AfricaMoldovaMoroccoNepalNetherlandsNicaraguaNigeriaNorth AmericaNorth MacedoniaNorthern AfricaNorthern EuropeNorwayOceaniaPakistanPanamaPeruPhilippinesPolandPortugalRomaniaRussiaSaudi ArabiaScotlandSenegalSerbiaSierra LeoneSingaporeSomaliaSouth AfricaSouth AmericaSouth Central AsiaSouth Eastern AsiaSouthern EuropeSpainSri LankaSt. Vincent and the GrenadinesSudanSwitzerlandSyriaTaiwanThailandTrinidad and TobagoTurkeyUgandaUkraineUruguayUzbekistanVenezuelaVietnamWest IndiesWestern AfricaWestern AsiaWestern EuropeYemenZaireZimbabweAzores
3 or more Vehicles in Household
Income
Poverty
Unemployment
Labor Participation
Family Structure
Vehicle Availability
Education Level
Disability

3 or more Vehicles in Household Comparison

Immigrants from Sweden

Mongolians

Fair
Tragic
19.2%
3 OR MORE VEHICLES IN HOUSEHOLD
29.0/ 100
METRIC RATING
186th/ 347
METRIC RANK
18.1%
3 OR MORE VEHICLES IN HOUSEHOLD
2.3/ 100
METRIC RATING
244th/ 347
METRIC RANK

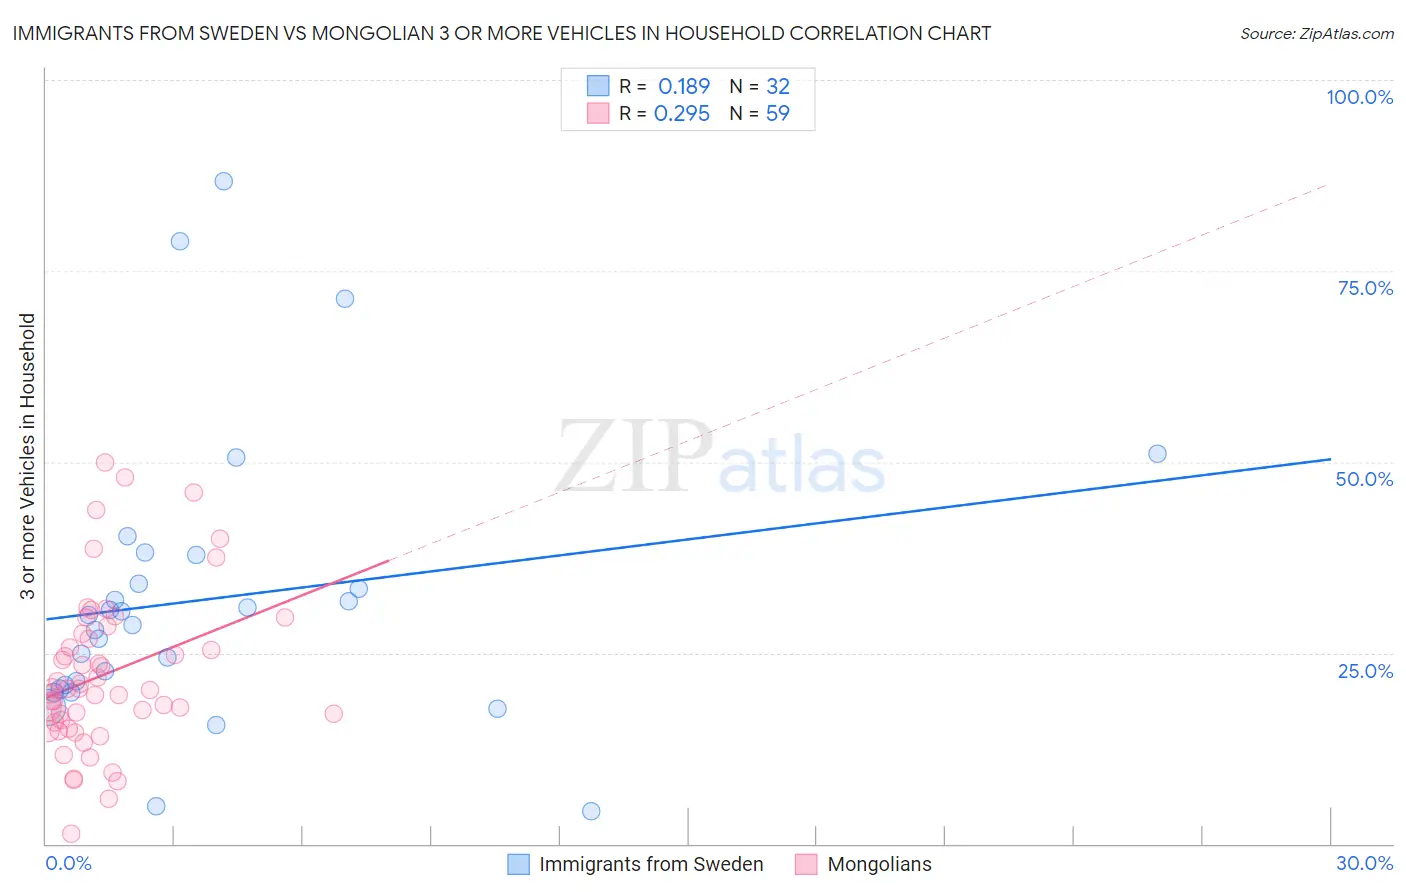
Immigrants from Sweden vs Mongolian 3 or more Vehicles in Household Correlation Chart

The statistical analysis conducted on geographies consisting of 164,661,279 people shows a poor positive correlation between the proportion of Immigrants from Sweden and percentage of households with 3 or more vehicles available in the United States with a correlation coefficient (R) of 0.189 and weighted average of 19.2%. Similarly, the statistical analysis conducted on geographies consisting of 140,244,475 people shows a weak positive correlation between the proportion of Mongolians and percentage of households with 3 or more vehicles available in the United States with a correlation coefficient (R) of 0.295 and weighted average of 18.1%, a difference of 5.8%.
Immigrants from Sweden vs Mongolian 3 or more Vehicles in Household

3 or more Vehicles in Household Correlation Summary

MeasurementImmigrants from SwedenMongolian
Minimum4.3%1.4%
Maximum86.7%50.0%
Range82.4%48.6%
Mean32.0%22.2%
Median29.2%20.2%
Interquartile 25% (IQ1)20.5%15.9%
Interquartile 75% (IQ3)35.9%27.4%
Interquartile Range (IQR)15.4%11.5%
Standard Deviation (Sample)18.6%10.3%
Standard Deviation (Population)18.3%10.2%

Similar Demographics by 3 or more Vehicles in Household

Demographics Similar to Immigrants from Sweden by 3 or more Vehicles in Household

In terms of 3 or more vehicles in household, the demographic groups most similar to Immigrants from Sweden are Immigrants from Hong Kong (19.2%, a difference of 0.060%), Immigrants from Sri Lanka (19.2%, a difference of 0.16%), Immigrants from Kuwait (19.1%, a difference of 0.28%), Indian (Asian) (19.1%, a difference of 0.29%), and Immigrants from Zimbabwe (19.1%, a difference of 0.34%).
DemographicsRating | Rank3 or more Vehicles in Household
Immigrants | South Central Asia
38.9
/100
|
#179
Fair
19.3%
South Africans
37.5
/100
|
#180
Fair
19.3%
Romanians
37.1
/100
|
#181
Fair
19.3%
Cubans
36.6
/100
|
#182
Fair
19.3%
Cajuns
36.0
/100
|
#183
Fair
19.3%
Latvians
35.7
/100
|
#184
Fair
19.3%
Immigrants | Sri Lanka
30.7
/100
|
#185
Fair
19.2%
Immigrants | Sweden
29.0
/100
|
#186
Fair
19.2%
Immigrants | Hong Kong
28.3
/100
|
#187
Fair
19.2%
Immigrants | Kuwait
26.1
/100
|
#188
Fair
19.1%
Indians (Asian)
26.0
/100
|
#189
Fair
19.1%
Immigrants | Zimbabwe
25.5
/100
|
#190
Fair
19.1%
South American Indians
25.4
/100
|
#191
Fair
19.1%
Kenyans
24.7
/100
|
#192
Fair
19.1%
Tsimshian
24.4
/100
|
#193
Fair
19.1%

Demographics Similar to Mongolians by 3 or more Vehicles in Household

In terms of 3 or more vehicles in household, the demographic groups most similar to Mongolians are Immigrants from Europe (18.1%, a difference of 0.12%), Immigrants from Belize (18.1%, a difference of 0.16%), Immigrants from Australia (18.1%, a difference of 0.23%), Hopi (18.2%, a difference of 0.24%), and African (18.2%, a difference of 0.35%).
DemographicsRating | Rank3 or more Vehicles in Household
Indonesians
3.5
/100
|
#237
Tragic
18.3%
Immigrants | Honduras
3.1
/100
|
#238
Tragic
18.2%
Immigrants | Middle Africa
3.1
/100
|
#239
Tragic
18.2%
Immigrants | China
2.9
/100
|
#240
Tragic
18.2%
Africans
2.7
/100
|
#241
Tragic
18.2%
Hopi
2.5
/100
|
#242
Tragic
18.2%
Immigrants | Europe
2.4
/100
|
#243
Tragic
18.1%
Mongolians
2.3
/100
|
#244
Tragic
18.1%
Immigrants | Belize
2.1
/100
|
#245
Tragic
18.1%
Immigrants | Australia
2.0
/100
|
#246
Tragic
18.1%
Carpatho Rusyns
1.9
/100
|
#247
Tragic
18.0%
Immigrants | Eastern Africa
1.8
/100
|
#248
Tragic
18.0%
Immigrants | Saudi Arabia
1.7
/100
|
#249
Tragic
18.0%
Venezuelans
1.7
/100
|
#250
Tragic
18.0%
Alsatians
1.5
/100
|
#251
Tragic
18.0%