Slavic vs Immigrants from Germany 3 or more Vehicles in Household

COMPARE

Slavic
Race
Ancestry
AfghanAfricanAlaska NativeAlaskan AthabascanAlbanianAleutAlsatianAmericanApacheArabArapahoArgentineanArmenianAssyrian/Chaldean/SyriacAustralianAustrianBahamianBangladeshiBarbadianBasqueBelgianBelizeanBermudanBhutaneseBlackfeetBolivianBrazilianBritishBritish West IndianBulgarianBurmeseCajunCambodianCanadianCape VerdeanCarpatho RusynCelticCentral AmericanCentral American IndianCherokeeCheyenneChickasawChileanChineseChippewaChoctawColombianColvilleComancheCosta RicanCreeCreekCroatianCrowCubanCypriotCzechCzechoslovakianDanishDelawareDominicanDutchDutch West IndianEastern EuropeanEcuadorianEgyptianEnglishEstonianEthiopianEuropeanFijianFilipinoFinnishFrenchFrench American IndianFrench CanadianGermanGerman RussianGhanaianGreekGuamanian/ChamorroGuatemalanGuyaneseHaitianHmongHonduranHopiHoumaHungarianIcelanderIndian (Asian)IndonesianInupiatIranianIraqiIrishIroquoisIsraeliItalianJamaicanJapaneseJordanianKenyanKiowaKoreanLaotianLatvianLebaneseLiberianLithuanianLumbeeLuxembourgerMacedonianMalaysianMalteseMarshalleseMenomineeMexicanMexican American IndianMongolianMoroccanNative HawaiianNavajoNepaleseNew ZealanderNicaraguanNigerianNorthern EuropeanNorwegianOkinawanOsageOttawaPaiutePakistaniPalestinianPanamanianParaguayanPennsylvania GermanPeruvianPimaPolishPortuguesePotawatomiPuebloPuerto RicanPuget Sound SalishRomanianRussianSalvadoranSamoanScandinavianScotch-IrishScottishSeminoleSenegaleseSerbianShoshoneSierra LeoneanSiouxSlavicSlovakSloveneSomaliSouth AfricanSouth AmericanSouth American IndianSoviet UnionSpaniardSpanishSpanish AmericanSpanish American IndianSri LankanSubsaharan AfricanSudaneseSwedishSwissSyrianTaiwaneseThaiTlingit-HaidaTohono O'OdhamTonganTrinidadian and TobagonianTsimshianTurkishU.S. Virgin IslanderUgandanUkrainianUruguayanUteVenezuelanVietnameseWelshWest IndianYakamaYaquiYugoslavianYumanYup'ikZimbabwean
Immigration
NonimmigrantsImmigrantsAfghanistanAfricaAlbaniaArgentinaArmeniaAsiaAustraliaAustriaBahamasBangladeshBarbadosBelarusBelgiumBelizeBoliviaBosnia and HerzegovinaBrazilBulgariaBurma/MyanmarCabo VerdeCambodiaCameroonCanadaCaribbeanCentral AmericaChileChinaColombiaCongoCosta RicaCroatiaCubaCzechoslovakiaDenmarkDominicaDominican RepublicEastern AfricaEastern AsiaEastern EuropeEcuadorEgyptEl SalvadorEnglandEritreaEthiopiaEuropeFijiFranceGhanaGreeceGrenadaGuatemalaGuyanaHaitiHondurasHong KongHungaryIndiaIndonesiaIranIraqIrelandIsraelItalyJamaicaJapanJordanKazakhstanKenyaKoreaKuwaitLaosLatin AmericaLatviaLebanonLiberiaLithuaniaMalaysiaMexicoMicronesiaMiddle AfricaMoldovaMoroccoNepalNetherlandsNicaraguaNigeriaNorth AmericaNorth MacedoniaNorthern AfricaNorthern EuropeNorwayOceaniaPakistanPanamaPeruPhilippinesPolandPortugalRomaniaRussiaSaudi ArabiaScotlandSenegalSerbiaSierra LeoneSingaporeSomaliaSouth AfricaSouth AmericaSouth Central AsiaSouth Eastern AsiaSouthern EuropeSpainSri LankaSt. Vincent and the GrenadinesSudanSwedenSwitzerlandSyriaTaiwanThailandTrinidad and TobagoTurkeyUgandaUkraineUruguayUzbekistanVenezuelaVietnamWest IndiesWestern AfricaWestern AsiaWestern EuropeYemenZaireZimbabweAzores
Immigrants from Germany
Race
Ancestry
AfghanAfricanAlaska NativeAlaskan AthabascanAlbanianAleutAlsatianAmericanApacheArabArapahoArgentineanArmenianAssyrian/Chaldean/SyriacAustralianAustrianBahamianBangladeshiBarbadianBasqueBelgianBelizeanBermudanBhutaneseBlackfeetBolivianBrazilianBritishBritish West IndianBulgarianBurmeseCajunCambodianCanadianCape VerdeanCarpatho RusynCelticCentral AmericanCentral American IndianCherokeeCheyenneChickasawChileanChineseChippewaChoctawColombianColvilleComancheCosta RicanCreeCreekCroatianCrowCubanCypriotCzechCzechoslovakianDanishDelawareDominicanDutchDutch West IndianEastern EuropeanEcuadorianEgyptianEnglishEstonianEthiopianEuropeanFijianFilipinoFinnishFrenchFrench American IndianFrench CanadianGermanGerman RussianGhanaianGreekGuamanian/ChamorroGuatemalanGuyaneseHaitianHmongHonduranHopiHoumaHungarianIcelanderIndian (Asian)IndonesianInupiatIranianIraqiIrishIroquoisIsraeliItalianJamaicanJapaneseJordanianKenyanKiowaKoreanLaotianLatvianLebaneseLiberianLithuanianLumbeeLuxembourgerMacedonianMalaysianMalteseMarshalleseMenomineeMexicanMexican American IndianMongolianMoroccanNative HawaiianNavajoNepaleseNew ZealanderNicaraguanNigerianNorthern EuropeanNorwegianOkinawanOsageOttawaPaiutePakistaniPalestinianPanamanianParaguayanPennsylvania GermanPeruvianPimaPolishPortuguesePotawatomiPuebloPuerto RicanPuget Sound SalishRomanianRussianSalvadoranSamoanScandinavianScotch-IrishScottishSeminoleSenegaleseSerbianShoshoneSierra LeoneanSiouxSlovakSloveneSomaliSouth AfricanSouth AmericanSouth American IndianSoviet UnionSpaniardSpanishSpanish AmericanSpanish American IndianSri LankanSubsaharan AfricanSudaneseSwedishSwissSyrianTaiwaneseThaiTlingit-HaidaTohono O'OdhamTonganTrinidadian and TobagonianTsimshianTurkishU.S. Virgin IslanderUgandanUkrainianUruguayanUteVenezuelanVietnameseWelshWest IndianYakamaYaquiYugoslavianYumanYup'ikZimbabwean
Immigration
NonimmigrantsImmigrantsAfghanistanAfricaAlbaniaArgentinaArmeniaAsiaAustraliaAustriaBahamasBangladeshBarbadosBelarusBelgiumBelizeBoliviaBosnia and HerzegovinaBrazilBulgariaBurma/MyanmarCabo VerdeCambodiaCameroonCanadaCaribbeanCentral AmericaChileChinaColombiaCongoCosta RicaCroatiaCubaCzechoslovakiaDenmarkDominicaDominican RepublicEastern AfricaEastern AsiaEastern EuropeEcuadorEgyptEl SalvadorEnglandEritreaEthiopiaEuropeFijiFranceGermanyGhanaGreeceGrenadaGuatemalaGuyanaHaitiHondurasHong KongHungaryIndiaIndonesiaIranIraqIrelandIsraelItalyJamaicaJapanJordanKazakhstanKenyaKoreaKuwaitLaosLatin AmericaLatviaLebanonLiberiaLithuaniaMalaysiaMexicoMicronesiaMiddle AfricaMoldovaMoroccoNepalNetherlandsNicaraguaNigeriaNorth AmericaNorth MacedoniaNorthern AfricaNorthern EuropeNorwayOceaniaPakistanPanamaPeruPhilippinesPolandPortugalRomaniaRussiaSaudi ArabiaScotlandSenegalSerbiaSierra LeoneSingaporeSomaliaSouth AfricaSouth AmericaSouth Central AsiaSouth Eastern AsiaSouthern EuropeSpainSri LankaSt. Vincent and the GrenadinesSudanSwedenSwitzerlandSyriaTaiwanThailandTrinidad and TobagoTurkeyUgandaUkraineUruguayUzbekistanVenezuelaVietnamWest IndiesWestern AfricaWestern AsiaWestern EuropeYemenZaireZimbabweAzores
3 or more Vehicles in Household
Income
Poverty
Unemployment
Labor Participation
Family Structure
Vehicle Availability
Education Level
Disability

3 or more Vehicles in Household Comparison

Slavs

Immigrants from Germany

Exceptional
Exceptional
20.4%
3 OR MORE VEHICLES IN HOUSEHOLD
92.1/ 100
METRIC RATING
126th/ 347
METRIC RANK
20.8%
3 OR MORE VEHICLES IN HOUSEHOLD
97.4/ 100
METRIC RATING
107th/ 347
METRIC RANK

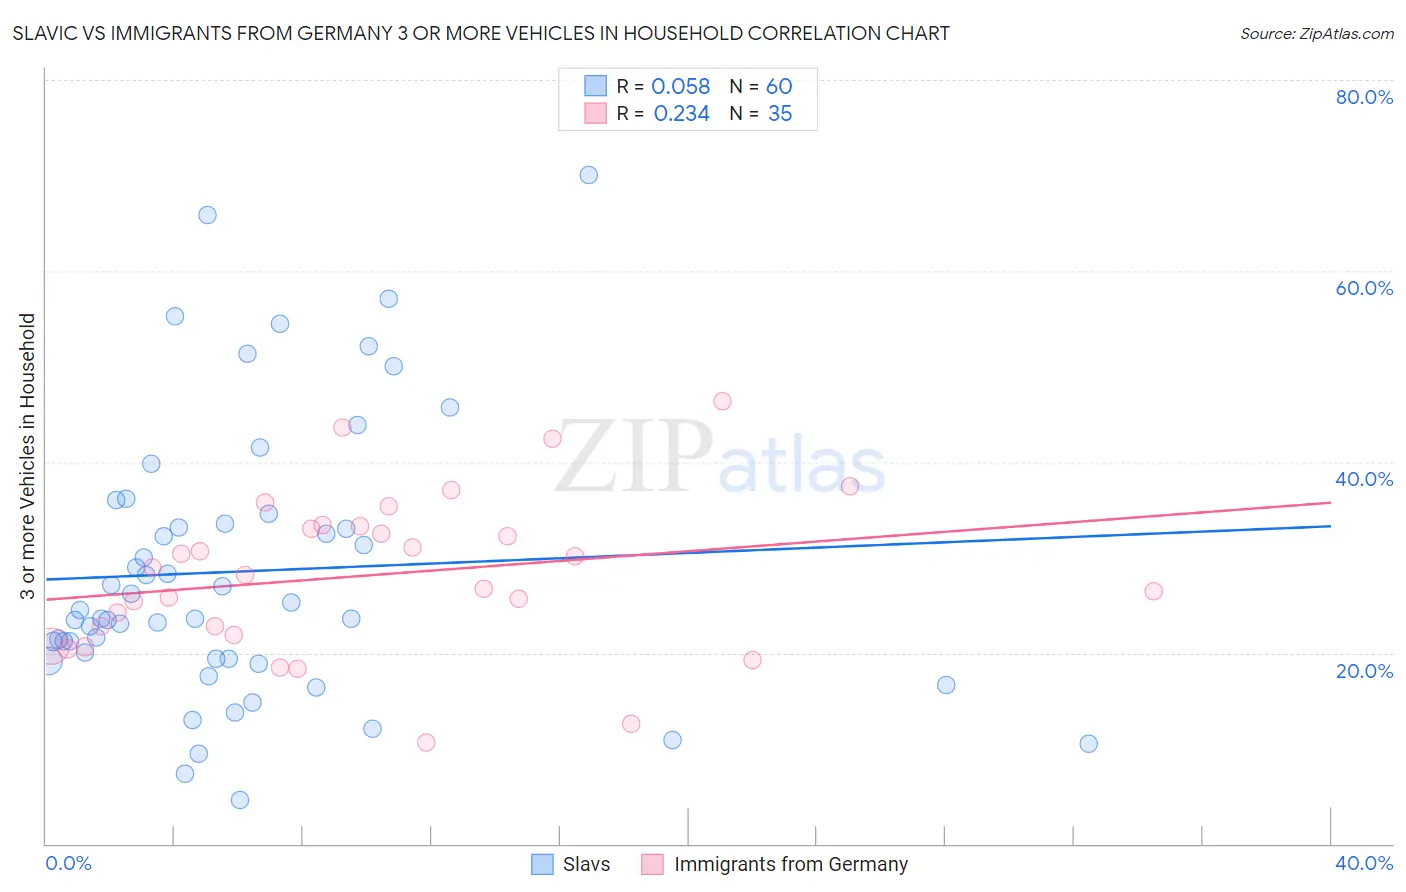
Slavic vs Immigrants from Germany 3 or more Vehicles in Household Correlation Chart

The statistical analysis conducted on geographies consisting of 270,770,751 people shows a slight positive correlation between the proportion of Slavs and percentage of households with 3 or more vehicles available in the United States with a correlation coefficient (R) of 0.058 and weighted average of 20.4%. Similarly, the statistical analysis conducted on geographies consisting of 463,650,570 people shows a weak positive correlation between the proportion of Immigrants from Germany and percentage of households with 3 or more vehicles available in the United States with a correlation coefficient (R) of 0.234 and weighted average of 20.8%, a difference of 2.1%.
Slavic vs Immigrants from Germany 3 or more Vehicles in Household

3 or more Vehicles in Household Correlation Summary

MeasurementSlavicImmigrants from Germany
Minimum4.6%10.6%
Maximum70.0%46.4%
Range65.4%35.8%
Mean28.5%28.1%
Median24.0%28.1%
Interquartile 25% (IQ1)19.4%21.9%
Interquartile 75% (IQ3)34.0%33.3%
Interquartile Range (IQR)14.6%11.4%
Standard Deviation (Sample)14.4%8.3%
Standard Deviation (Population)14.3%8.1%

Demographics Similar to Slavs and Immigrants from Germany by 3 or more Vehicles in Household

In terms of 3 or more vehicles in household, the demographic groups most similar to Slavs are Immigrants from Netherlands (20.4%, a difference of 0.21%), Central American (20.5%, a difference of 0.24%), German Russian (20.5%, a difference of 0.42%), Immigrants from Korea (20.5%, a difference of 0.42%), and Immigrants from Thailand (20.5%, a difference of 0.47%). Similarly, the demographic groups most similar to Immigrants from Germany are Bolivian (20.8%, a difference of 0.040%), Immigrants from Scotland (20.8%, a difference of 0.15%), Filipino (20.8%, a difference of 0.21%), Asian (20.8%, a difference of 0.35%), and Immigrants from Micronesia (20.7%, a difference of 0.38%).
DemographicsRating | Rank3 or more Vehicles in Household
Bolivians
97.4
/100
|
#106
Exceptional
20.8%
Immigrants | Germany
97.4
/100
|
#107
Exceptional
20.8%
Immigrants | Scotland
97.1
/100
|
#108
Exceptional
20.8%
Filipinos
97.0
/100
|
#109
Exceptional
20.8%
Asians
96.8
/100
|
#110
Exceptional
20.8%
Immigrants | Micronesia
96.7
/100
|
#111
Exceptional
20.7%
Nicaraguans
96.2
/100
|
#112
Exceptional
20.7%
Immigrants | England
96.2
/100
|
#113
Exceptional
20.7%
Burmese
95.8
/100
|
#114
Exceptional
20.6%
French Canadians
95.0
/100
|
#115
Exceptional
20.6%
Italians
94.9
/100
|
#116
Exceptional
20.6%
Croatians
94.9
/100
|
#117
Exceptional
20.6%
Costa Ricans
94.6
/100
|
#118
Exceptional
20.6%
Immigrants | Latin America
94.5
/100
|
#119
Exceptional
20.5%
Maltese
93.9
/100
|
#120
Exceptional
20.5%
Immigrants | Thailand
93.8
/100
|
#121
Exceptional
20.5%
German Russians
93.7
/100
|
#122
Exceptional
20.5%
Immigrants | Korea
93.7
/100
|
#123
Exceptional
20.5%
Central Americans
93.1
/100
|
#124
Exceptional
20.5%
Immigrants | Netherlands
92.9
/100
|
#125
Exceptional
20.4%
Slavs
92.1
/100
|
#126
Exceptional
20.4%