Sioux vs Alaska Native 1 or more Vehicles in Household
COMPARE
Sioux
Alaska Native
1 or more Vehicles in Household
1 or more Vehicles in Household Comparison
Sioux
Alaska Natives
90.2%
1 OR MORE VEHICLES IN HOUSEHOLD
81.3/ 100
METRIC RATING
145th/ 347
METRIC RANK
83.8%
1 OR MORE VEHICLES IN HOUSEHOLD
0.0/ 100
METRIC RATING
316th/ 347
METRIC RANK
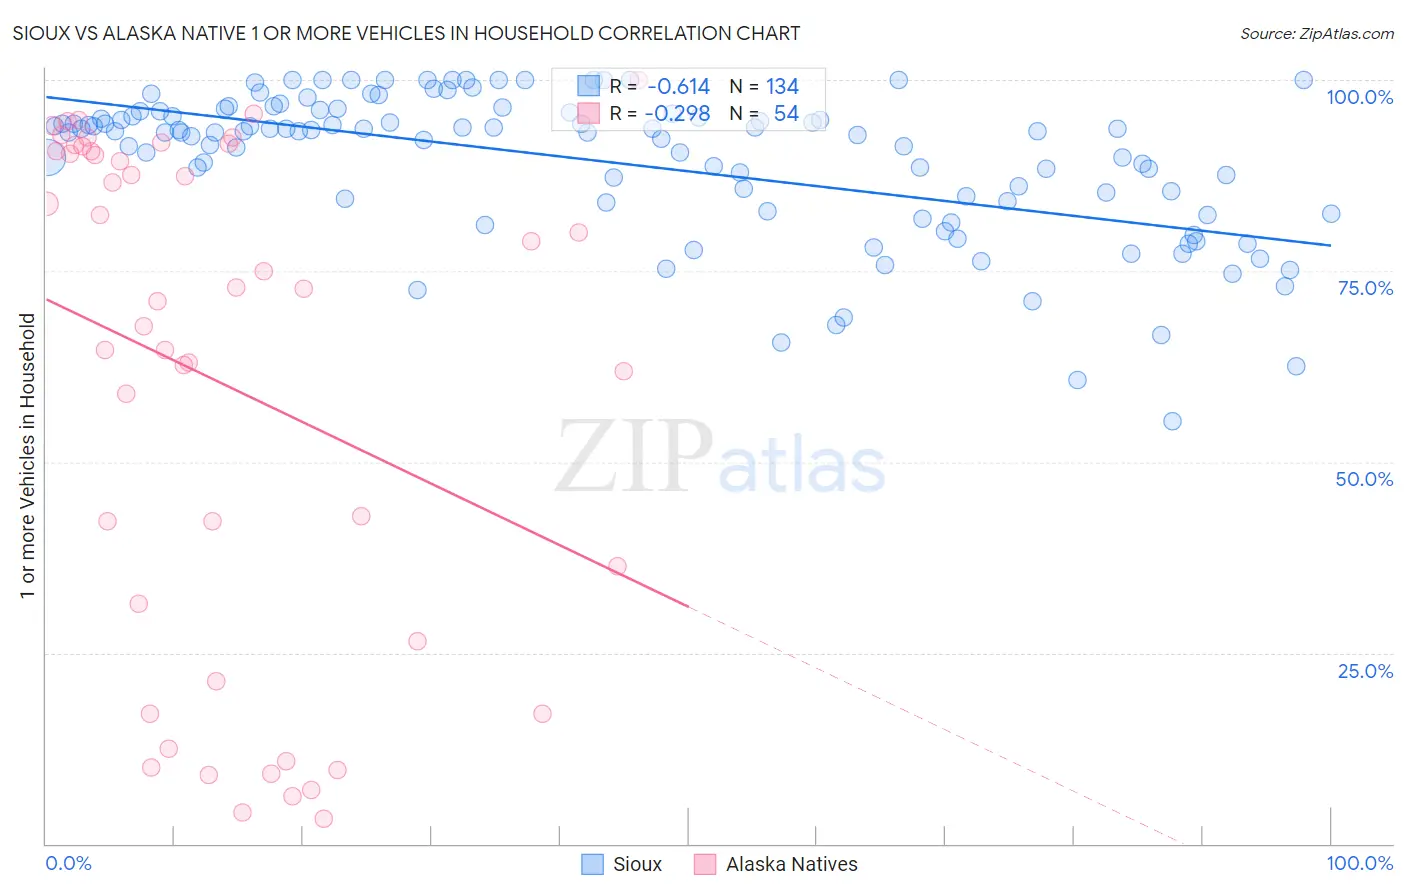
Sioux vs Alaska Native 1 or more Vehicles in Household Correlation Chart
The statistical analysis conducted on geographies consisting of 234,124,417 people shows a significant negative correlation between the proportion of Sioux and percentage of households with 1 or more vehicles available in the United States with a correlation coefficient (R) of -0.614 and weighted average of 90.2%. Similarly, the statistical analysis conducted on geographies consisting of 76,754,392 people shows a weak negative correlation between the proportion of Alaska Natives and percentage of households with 1 or more vehicles available in the United States with a correlation coefficient (R) of -0.298 and weighted average of 83.8%, a difference of 7.6%.
1 or more Vehicles in Household Correlation Summary
| Measurement | Sioux | Alaska Native |
| Minimum | 55.3% | 3.3% |
| Maximum | 100.0% | 100.0% |
| Range | 44.7% | 96.7% |
| Mean | 89.3% | 60.3% |
| Median | 93.2% | 71.9% |
| Interquartile 25% (IQ1) | 84.2% | 26.5% |
| Interquartile 75% (IQ3) | 95.5% | 90.6% |
| Interquartile Range (IQR) | 11.3% | 64.1% |
| Standard Deviation (Sample) | 9.5% | 33.2% |
| Standard Deviation (Population) | 9.5% | 32.9% |
Similar Demographics by 1 or more Vehicles in Household
Demographics Similar to Sioux by 1 or more Vehicles in Household
In terms of 1 or more vehicles in household, the demographic groups most similar to Sioux are Immigrants from Zimbabwe (90.2%, a difference of 0.0%), Immigrants from Bahamas (90.2%, a difference of 0.010%), Bahamian (90.2%, a difference of 0.020%), Immigrants from Lithuania (90.2%, a difference of 0.040%), and Chilean (90.2%, a difference of 0.040%).
| Demographics | Rating | Rank | 1 or more Vehicles in Household |
| Syrians | 86.3 /100 | #138 | Excellent 90.3% |
| Estonians | 85.6 /100 | #139 | Excellent 90.3% |
| Sudanese | 85.2 /100 | #140 | Excellent 90.3% |
| Immigrants | Moldova | 83.1 /100 | #141 | Excellent 90.2% |
| Immigrants | Lithuania | 83.0 /100 | #142 | Excellent 90.2% |
| Immigrants | Bahamas | 81.5 /100 | #143 | Excellent 90.2% |
| Immigrants | Zimbabwe | 81.5 /100 | #144 | Excellent 90.2% |
| Sioux | 81.3 /100 | #145 | Excellent 90.2% |
| Bahamians | 80.5 /100 | #146 | Excellent 90.2% |
| Chileans | 79.8 /100 | #147 | Good 90.2% |
| Immigrants | Eastern Africa | 78.2 /100 | #148 | Good 90.1% |
| Immigrants | Nicaragua | 76.7 /100 | #149 | Good 90.1% |
| Immigrants | Micronesia | 75.9 /100 | #150 | Good 90.1% |
| Immigrants | Bosnia and Herzegovina | 75.4 /100 | #151 | Good 90.1% |
| Tlingit-Haida | 74.3 /100 | #152 | Good 90.1% |
Demographics Similar to Alaska Natives by 1 or more Vehicles in Household
In terms of 1 or more vehicles in household, the demographic groups most similar to Alaska Natives are Ghanaian (83.6%, a difference of 0.22%), Immigrants from Ghana (83.4%, a difference of 0.42%), Immigrants from Belarus (83.3%, a difference of 0.55%), Cypriot (84.4%, a difference of 0.69%), and Albanian (84.4%, a difference of 0.76%).
| Demographics | Rating | Rank | 1 or more Vehicles in Household |
| Immigrants | Haiti | 0.0 /100 | #309 | Tragic 84.7% |
| U.S. Virgin Islanders | 0.0 /100 | #310 | Tragic 84.6% |
| Puerto Ricans | 0.0 /100 | #311 | Tragic 84.6% |
| Cape Verdeans | 0.0 /100 | #312 | Tragic 84.5% |
| Immigrants | Israel | 0.0 /100 | #313 | Tragic 84.5% |
| Albanians | 0.0 /100 | #314 | Tragic 84.4% |
| Cypriots | 0.0 /100 | #315 | Tragic 84.4% |
| Alaska Natives | 0.0 /100 | #316 | Tragic 83.8% |
| Ghanaians | 0.0 /100 | #317 | Tragic 83.6% |
| Immigrants | Ghana | 0.0 /100 | #318 | Tragic 83.4% |
| Immigrants | Belarus | 0.0 /100 | #319 | Tragic 83.3% |
| Soviet Union | 0.0 /100 | #320 | Tragic 82.7% |
| Jamaicans | 0.0 /100 | #321 | Tragic 82.1% |
| Immigrants | Cabo Verde | 0.0 /100 | #322 | Tragic 81.6% |
| Immigrants | Yemen | 0.0 /100 | #323 | Tragic 80.5% |