Sioux vs Aleut Unemployment Among Ages 16 to 19 years
COMPARE
Sioux
Aleut
Unemployment Among Ages 16 to 19 years
Unemployment Among Ages 16 to 19 years Comparison
Sioux
Aleuts
19.7%
UNEMPLOYMENT AMONG AGES 16 TO 19 YEARS
0.0/ 100
METRIC RATING
283rd/ 347
METRIC RANK
21.2%
UNEMPLOYMENT AMONG AGES 16 TO 19 YEARS
0.0/ 100
METRIC RATING
304th/ 347
METRIC RANK
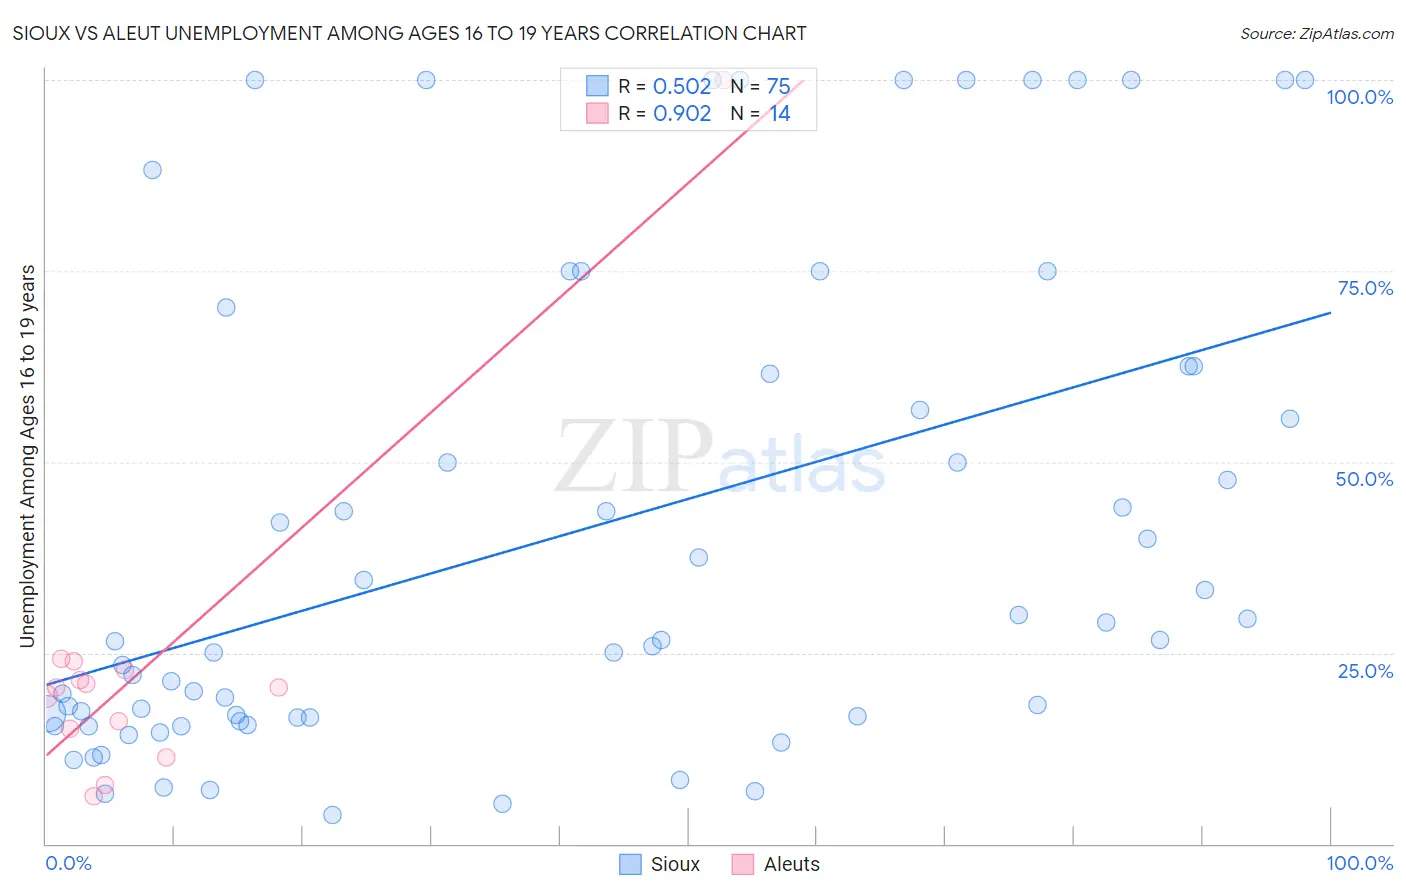
Sioux vs Aleut Unemployment Among Ages 16 to 19 years Correlation Chart
The statistical analysis conducted on geographies consisting of 225,477,906 people shows a substantial positive correlation between the proportion of Sioux and unemployment rate among population between the ages 16 and 19 in the United States with a correlation coefficient (R) of 0.502 and weighted average of 19.7%. Similarly, the statistical analysis conducted on geographies consisting of 60,781,388 people shows a near-perfect positive correlation between the proportion of Aleuts and unemployment rate among population between the ages 16 and 19 in the United States with a correlation coefficient (R) of 0.902 and weighted average of 21.2%, a difference of 7.3%.
Unemployment Among Ages 16 to 19 years Correlation Summary
| Measurement | Sioux | Aleut |
| Minimum | 3.7% | 6.2% |
| Maximum | 100.0% | 100.0% |
| Range | 96.3% | 93.8% |
| Mean | 40.6% | 23.6% |
| Median | 26.6% | 20.4% |
| Interquartile 25% (IQ1) | 16.5% | 15.1% |
| Interquartile 75% (IQ3) | 62.5% | 22.8% |
| Interquartile Range (IQR) | 46.0% | 7.7% |
| Standard Deviation (Sample) | 31.6% | 22.7% |
| Standard Deviation (Population) | 31.4% | 21.9% |
Similar Demographics by Unemployment Among Ages 16 to 19 years
Demographics Similar to Sioux by Unemployment Among Ages 16 to 19 years
In terms of unemployment among ages 16 to 19 years, the demographic groups most similar to Sioux are Sierra Leonean (19.7%, a difference of 0.010%), Dutch West Indian (19.7%, a difference of 0.050%), Ghanaian (19.8%, a difference of 0.19%), Bahamian (19.8%, a difference of 0.31%), and Immigrants from Ghana (19.8%, a difference of 0.38%).
| Demographics | Rating | Rank | Unemployment Among Ages 16 to 19 years |
| Immigrants | Latin America | 0.0 /100 | #276 | Tragic 19.4% |
| Immigrants | Western Africa | 0.0 /100 | #277 | Tragic 19.4% |
| Africans | 0.0 /100 | #278 | Tragic 19.5% |
| Ute | 0.0 /100 | #279 | Tragic 19.6% |
| Cajuns | 0.0 /100 | #280 | Tragic 19.6% |
| Cypriots | 0.0 /100 | #281 | Tragic 19.6% |
| Dutch West Indians | 0.0 /100 | #282 | Tragic 19.7% |
| Sioux | 0.0 /100 | #283 | Tragic 19.7% |
| Sierra Leoneans | 0.0 /100 | #284 | Tragic 19.7% |
| Ghanaians | 0.0 /100 | #285 | Tragic 19.8% |
| Bahamians | 0.0 /100 | #286 | Tragic 19.8% |
| Immigrants | Ghana | 0.0 /100 | #287 | Tragic 19.8% |
| Immigrants | Azores | 0.0 /100 | #288 | Tragic 19.8% |
| Pueblo | 0.0 /100 | #289 | Tragic 19.8% |
| Immigrants | Sierra Leone | 0.0 /100 | #290 | Tragic 20.0% |
Demographics Similar to Aleuts by Unemployment Among Ages 16 to 19 years
In terms of unemployment among ages 16 to 19 years, the demographic groups most similar to Aleuts are Immigrants from Senegal (21.2%, a difference of 0.16%), U.S. Virgin Islander (21.3%, a difference of 0.56%), Senegalese (21.0%, a difference of 0.86%), Black/African American (21.4%, a difference of 1.1%), and Immigrants from Caribbean (20.9%, a difference of 1.2%).
| Demographics | Rating | Rank | Unemployment Among Ages 16 to 19 years |
| Alsatians | 0.0 /100 | #297 | Tragic 20.5% |
| Haitians | 0.0 /100 | #298 | Tragic 20.5% |
| Immigrants | Uzbekistan | 0.0 /100 | #299 | Tragic 20.5% |
| Ecuadorians | 0.0 /100 | #300 | Tragic 20.5% |
| Immigrants | Ecuador | 0.0 /100 | #301 | Tragic 20.9% |
| Immigrants | Caribbean | 0.0 /100 | #302 | Tragic 20.9% |
| Senegalese | 0.0 /100 | #303 | Tragic 21.0% |
| Aleuts | 0.0 /100 | #304 | Tragic 21.2% |
| Immigrants | Senegal | 0.0 /100 | #305 | Tragic 21.2% |
| U.S. Virgin Islanders | 0.0 /100 | #306 | Tragic 21.3% |
| Blacks/African Americans | 0.0 /100 | #307 | Tragic 21.4% |
| Immigrants | Bangladesh | 0.0 /100 | #308 | Tragic 21.5% |
| Natives/Alaskans | 0.0 /100 | #309 | Tragic 21.5% |
| Vietnamese | 0.0 /100 | #310 | Tragic 21.5% |
| Belizeans | 0.0 /100 | #311 | Tragic 21.6% |