Shoshone vs Latvian 3 or more Vehicles in Household
COMPARE
Shoshone
Latvian
3 or more Vehicles in Household
3 or more Vehicles in Household Comparison
Shoshone
Latvians
24.9%
3 OR MORE VEHICLES IN HOUSEHOLD
100.0/ 100
METRIC RATING
11th/ 347
METRIC RANK
19.3%
3 OR MORE VEHICLES IN HOUSEHOLD
35.7/ 100
METRIC RATING
184th/ 347
METRIC RANK
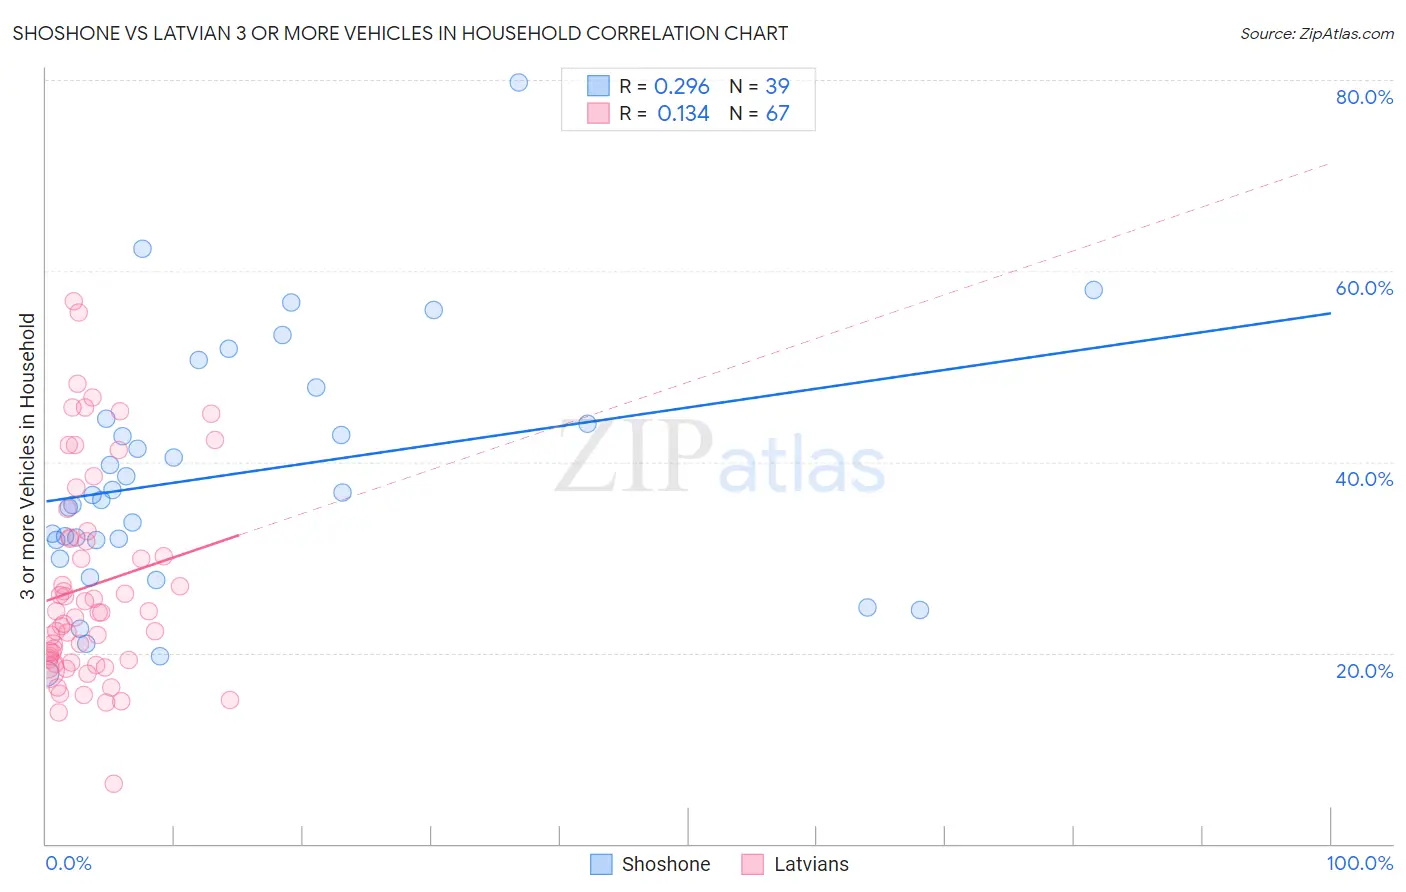
Shoshone vs Latvian 3 or more Vehicles in Household Correlation Chart
The statistical analysis conducted on geographies consisting of 66,615,366 people shows a weak positive correlation between the proportion of Shoshone and percentage of households with 3 or more vehicles available in the United States with a correlation coefficient (R) of 0.296 and weighted average of 24.9%. Similarly, the statistical analysis conducted on geographies consisting of 220,591,398 people shows a poor positive correlation between the proportion of Latvians and percentage of households with 3 or more vehicles available in the United States with a correlation coefficient (R) of 0.134 and weighted average of 19.3%, a difference of 29.1%.
3 or more Vehicles in Household Correlation Summary
| Measurement | Shoshone | Latvian |
| Minimum | 17.9% | 6.2% |
| Maximum | 79.7% | 56.8% |
| Range | 61.9% | 50.6% |
| Mean | 38.7% | 27.0% |
| Median | 36.5% | 24.2% |
| Interquartile 25% (IQ1) | 31.8% | 19.0% |
| Interquartile 75% (IQ3) | 44.5% | 32.0% |
| Interquartile Range (IQR) | 12.7% | 13.0% |
| Standard Deviation (Sample) | 13.0% | 10.9% |
| Standard Deviation (Population) | 12.8% | 10.9% |
Similar Demographics by 3 or more Vehicles in Household
Demographics Similar to Shoshone by 3 or more Vehicles in Household
In terms of 3 or more vehicles in household, the demographic groups most similar to Shoshone are Nepalese (24.9%, a difference of 0.10%), Native Hawaiian (24.9%, a difference of 0.19%), Samoan (25.0%, a difference of 0.29%), Danish (24.7%, a difference of 0.69%), and Mexican (24.7%, a difference of 0.77%).
| Demographics | Rating | Rank | 3 or more Vehicles in Household |
| Arapaho | 100.0 /100 | #4 | Exceptional 26.4% |
| Puget Sound Salish | 100.0 /100 | #5 | Exceptional 26.4% |
| Immigrants | Fiji | 100.0 /100 | #6 | Exceptional 26.1% |
| Colville | 100.0 /100 | #7 | Exceptional 25.8% |
| Samoans | 100.0 /100 | #8 | Exceptional 25.0% |
| Native Hawaiians | 100.0 /100 | #9 | Exceptional 24.9% |
| Nepalese | 100.0 /100 | #10 | Exceptional 24.9% |
| Shoshone | 100.0 /100 | #11 | Exceptional 24.9% |
| Danes | 100.0 /100 | #12 | Exceptional 24.7% |
| Mexicans | 100.0 /100 | #13 | Exceptional 24.7% |
| Immigrants | Mexico | 100.0 /100 | #14 | Exceptional 24.6% |
| Hawaiians | 100.0 /100 | #15 | Exceptional 24.3% |
| Basques | 100.0 /100 | #16 | Exceptional 24.3% |
| Koreans | 100.0 /100 | #17 | Exceptional 24.1% |
| Norwegians | 100.0 /100 | #18 | Exceptional 23.9% |
Demographics Similar to Latvians by 3 or more Vehicles in Household
In terms of 3 or more vehicles in household, the demographic groups most similar to Latvians are Cajun (19.3%, a difference of 0.020%), Cuban (19.3%, a difference of 0.070%), Romanian (19.3%, a difference of 0.11%), South African (19.3%, a difference of 0.15%), and Immigrants from South Central Asia (19.3%, a difference of 0.26%).
| Demographics | Rating | Rank | 3 or more Vehicles in Household |
| Immigrants | Peru | 41.1 /100 | #177 | Average 19.4% |
| Immigrants | Syria | 40.3 /100 | #178 | Average 19.4% |
| Immigrants | South Central Asia | 38.9 /100 | #179 | Fair 19.3% |
| South Africans | 37.5 /100 | #180 | Fair 19.3% |
| Romanians | 37.1 /100 | #181 | Fair 19.3% |
| Cubans | 36.6 /100 | #182 | Fair 19.3% |
| Cajuns | 36.0 /100 | #183 | Fair 19.3% |
| Latvians | 35.7 /100 | #184 | Fair 19.3% |
| Immigrants | Sri Lanka | 30.7 /100 | #185 | Fair 19.2% |
| Immigrants | Sweden | 29.0 /100 | #186 | Fair 19.2% |
| Immigrants | Hong Kong | 28.3 /100 | #187 | Fair 19.2% |
| Immigrants | Kuwait | 26.1 /100 | #188 | Fair 19.1% |
| Indians (Asian) | 26.0 /100 | #189 | Fair 19.1% |
| Immigrants | Zimbabwe | 25.5 /100 | #190 | Fair 19.1% |
| South American Indians | 25.4 /100 | #191 | Fair 19.1% |