Shoshone vs Latvian Unemployment Among Ages 60 to 64 years
COMPARE
Shoshone
Latvian
Unemployment Among Ages 60 to 64 years
Unemployment Among Ages 60 to 64 years Comparison
Shoshone
Latvians
5.7%
UNEMPLOYMENT AMONG AGES 60 TO 64 YEARS
0.0/ 100
METRIC RATING
317th/ 347
METRIC RANK
4.8%
UNEMPLOYMENT AMONG AGES 60 TO 64 YEARS
79.1/ 100
METRIC RATING
148th/ 347
METRIC RANK
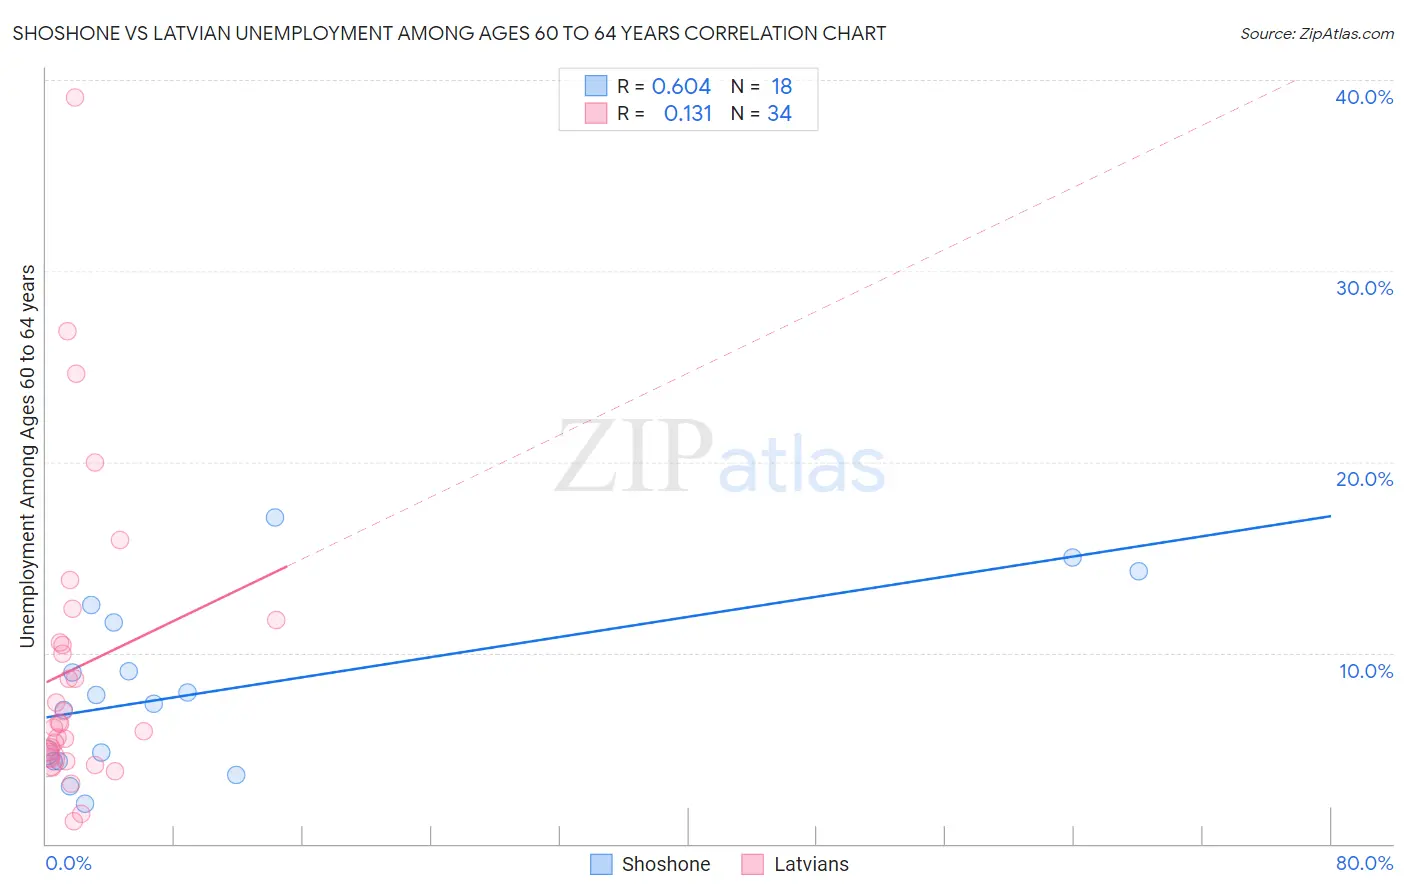
Shoshone vs Latvian Unemployment Among Ages 60 to 64 years Correlation Chart
The statistical analysis conducted on geographies consisting of 63,439,226 people shows a significant positive correlation between the proportion of Shoshone and unemployment rate among population between the ages 60 and 64 in the United States with a correlation coefficient (R) of 0.604 and weighted average of 5.7%. Similarly, the statistical analysis conducted on geographies consisting of 207,612,955 people shows a poor positive correlation between the proportion of Latvians and unemployment rate among population between the ages 60 and 64 in the United States with a correlation coefficient (R) of 0.131 and weighted average of 4.8%, a difference of 17.8%.
Unemployment Among Ages 60 to 64 years Correlation Summary
| Measurement | Shoshone | Latvian |
| Minimum | 2.1% | 1.2% |
| Maximum | 17.1% | 39.1% |
| Range | 15.0% | 37.9% |
| Mean | 8.1% | 9.2% |
| Median | 7.5% | 6.2% |
| Interquartile 25% (IQ1) | 4.3% | 4.5% |
| Interquartile 75% (IQ3) | 11.6% | 10.5% |
| Interquartile Range (IQR) | 7.3% | 6.0% |
| Standard Deviation (Sample) | 4.4% | 8.0% |
| Standard Deviation (Population) | 4.3% | 7.9% |
Similar Demographics by Unemployment Among Ages 60 to 64 years
Demographics Similar to Shoshone by Unemployment Among Ages 60 to 64 years
In terms of unemployment among ages 60 to 64 years, the demographic groups most similar to Shoshone are Native/Alaskan (5.7%, a difference of 0.050%), Immigrants from Belize (5.7%, a difference of 0.54%), Cheyenne (5.6%, a difference of 0.87%), Cree (5.6%, a difference of 1.2%), and Colville (5.7%, a difference of 1.3%).
| Demographics | Rating | Rank | Unemployment Among Ages 60 to 64 years |
| British West Indians | 0.0 /100 | #310 | Tragic 5.5% |
| U.S. Virgin Islanders | 0.0 /100 | #311 | Tragic 5.5% |
| Immigrants | West Indies | 0.0 /100 | #312 | Tragic 5.5% |
| Belizeans | 0.0 /100 | #313 | Tragic 5.5% |
| Guyanese | 0.0 /100 | #314 | Tragic 5.5% |
| Cree | 0.0 /100 | #315 | Tragic 5.6% |
| Cheyenne | 0.0 /100 | #316 | Tragic 5.6% |
| Shoshone | 0.0 /100 | #317 | Tragic 5.7% |
| Natives/Alaskans | 0.0 /100 | #318 | Tragic 5.7% |
| Immigrants | Belize | 0.0 /100 | #319 | Tragic 5.7% |
| Colville | 0.0 /100 | #320 | Tragic 5.7% |
| Dutch West Indians | 0.0 /100 | #321 | Tragic 5.7% |
| Ecuadorians | 0.0 /100 | #322 | Tragic 5.8% |
| Alsatians | 0.0 /100 | #323 | Tragic 5.8% |
| Immigrants | Ecuador | 0.0 /100 | #324 | Tragic 5.8% |
Demographics Similar to Latvians by Unemployment Among Ages 60 to 64 years
In terms of unemployment among ages 60 to 64 years, the demographic groups most similar to Latvians are Arab (4.8%, a difference of 0.020%), Immigrants from Italy (4.8%, a difference of 0.020%), Immigrants from South Africa (4.8%, a difference of 0.030%), Mongolian (4.8%, a difference of 0.12%), and Turkish (4.8%, a difference of 0.16%).
| Demographics | Rating | Rank | Unemployment Among Ages 60 to 64 years |
| Panamanians | 85.5 /100 | #141 | Excellent 4.8% |
| Immigrants | Ethiopia | 85.3 /100 | #142 | Excellent 4.8% |
| Italians | 85.0 /100 | #143 | Excellent 4.8% |
| Immigrants | Pakistan | 83.3 /100 | #144 | Excellent 4.8% |
| Burmese | 83.1 /100 | #145 | Excellent 4.8% |
| Turks | 81.9 /100 | #146 | Excellent 4.8% |
| Mongolians | 81.2 /100 | #147 | Excellent 4.8% |
| Latvians | 79.1 /100 | #148 | Good 4.8% |
| Arabs | 78.8 /100 | #149 | Good 4.8% |
| Immigrants | Italy | 78.7 /100 | #150 | Good 4.8% |
| Immigrants | South Africa | 78.5 /100 | #151 | Good 4.8% |
| Americans | 75.7 /100 | #152 | Good 4.8% |
| Bolivians | 75.5 /100 | #153 | Good 4.8% |
| Chileans | 72.6 /100 | #154 | Good 4.8% |
| Filipinos | 72.1 /100 | #155 | Good 4.8% |