Shoshone vs Latvian Male Disability
COMPARE
Shoshone
Latvian
Male Disability
Male Disability Comparison
Shoshone
Latvians
13.8%
MALE DISABILITY
0.0/ 100
METRIC RATING
321st/ 347
METRIC RANK
11.1%
MALE DISABILITY
68.1/ 100
METRIC RATING
158th/ 347
METRIC RANK
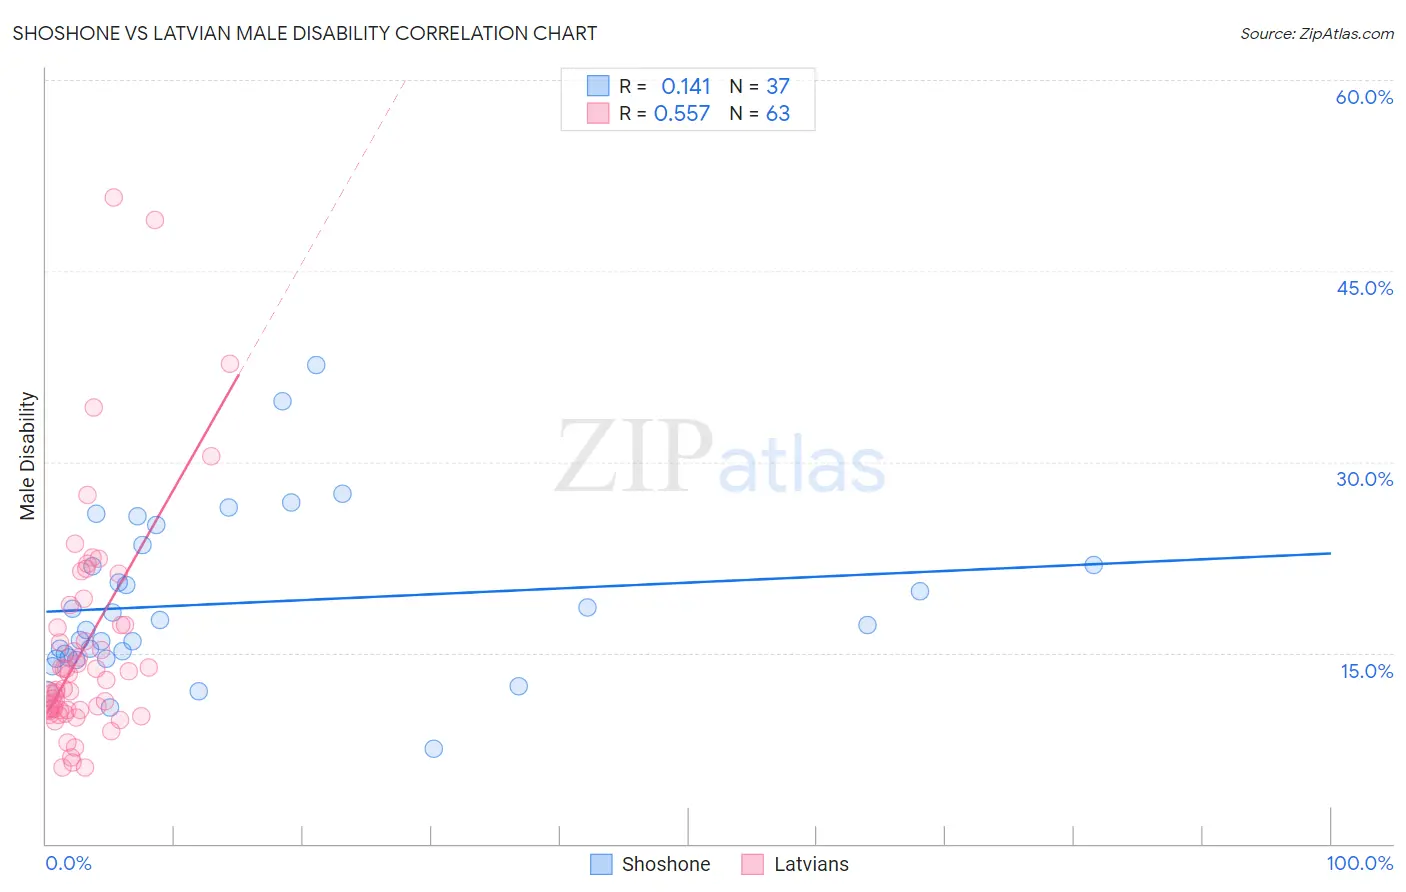
Shoshone vs Latvian Male Disability Correlation Chart
The statistical analysis conducted on geographies consisting of 66,619,814 people shows a poor positive correlation between the proportion of Shoshone and percentage of males with a disability in the United States with a correlation coefficient (R) of 0.141 and weighted average of 13.8%. Similarly, the statistical analysis conducted on geographies consisting of 220,715,476 people shows a substantial positive correlation between the proportion of Latvians and percentage of males with a disability in the United States with a correlation coefficient (R) of 0.557 and weighted average of 11.1%, a difference of 24.7%.
Male Disability Correlation Summary
| Measurement | Shoshone | Latvian |
| Minimum | 7.4% | 6.0% |
| Maximum | 37.6% | 50.8% |
| Range | 30.1% | 44.8% |
| Mean | 18.9% | 15.6% |
| Median | 17.1% | 12.8% |
| Interquartile 25% (IQ1) | 14.6% | 10.5% |
| Interquartile 75% (IQ3) | 22.7% | 17.2% |
| Interquartile Range (IQR) | 8.1% | 6.7% |
| Standard Deviation (Sample) | 6.5% | 9.0% |
| Standard Deviation (Population) | 6.4% | 8.9% |
Similar Demographics by Male Disability
Demographics Similar to Shoshone by Male Disability
In terms of male disability, the demographic groups most similar to Shoshone are Tlingit-Haida (13.8%, a difference of 0.050%), American (13.8%, a difference of 0.54%), Cree (13.7%, a difference of 0.96%), Apache (14.0%, a difference of 1.1%), and Paiute (13.7%, a difference of 1.2%).
| Demographics | Rating | Rank | Male Disability |
| Aleuts | 0.0 /100 | #314 | Tragic 13.5% |
| Iroquois | 0.0 /100 | #315 | Tragic 13.6% |
| Alaska Natives | 0.0 /100 | #316 | Tragic 13.6% |
| Paiute | 0.0 /100 | #317 | Tragic 13.7% |
| Cree | 0.0 /100 | #318 | Tragic 13.7% |
| Americans | 0.0 /100 | #319 | Tragic 13.8% |
| Tlingit-Haida | 0.0 /100 | #320 | Tragic 13.8% |
| Shoshone | 0.0 /100 | #321 | Tragic 13.8% |
| Apache | 0.0 /100 | #322 | Tragic 14.0% |
| Osage | 0.0 /100 | #323 | Tragic 14.0% |
| Comanche | 0.0 /100 | #324 | Tragic 14.1% |
| Ottawa | 0.0 /100 | #325 | Tragic 14.1% |
| Natives/Alaskans | 0.0 /100 | #326 | Tragic 14.2% |
| Potawatomi | 0.0 /100 | #327 | Tragic 14.2% |
| Chippewa | 0.0 /100 | #328 | Tragic 14.3% |
Demographics Similar to Latvians by Male Disability
In terms of male disability, the demographic groups most similar to Latvians are Guatemalan (11.1%, a difference of 0.060%), Immigrants from Western Africa (11.1%, a difference of 0.070%), Russian (11.1%, a difference of 0.11%), Albanian (11.1%, a difference of 0.11%), and Immigrants from West Indies (11.1%, a difference of 0.16%).
| Demographics | Rating | Rank | Male Disability |
| Cubans | 74.9 /100 | #151 | Good 11.0% |
| Immigrants | Albania | 74.4 /100 | #152 | Good 11.0% |
| Immigrants | Northern Europe | 73.2 /100 | #153 | Good 11.1% |
| Immigrants | Moldova | 72.8 /100 | #154 | Good 11.1% |
| Immigrants | Middle Africa | 70.9 /100 | #155 | Good 11.1% |
| Russians | 69.8 /100 | #156 | Good 11.1% |
| Immigrants | Western Africa | 69.2 /100 | #157 | Good 11.1% |
| Latvians | 68.1 /100 | #158 | Good 11.1% |
| Guatemalans | 67.2 /100 | #159 | Good 11.1% |
| Albanians | 66.5 /100 | #160 | Good 11.1% |
| Immigrants | West Indies | 65.7 /100 | #161 | Good 11.1% |
| Immigrants | Haiti | 65.3 /100 | #162 | Good 11.1% |
| Immigrants | Kenya | 63.8 /100 | #163 | Good 11.1% |
| British West Indians | 62.8 /100 | #164 | Good 11.1% |
| Luxembourgers | 61.9 /100 | #165 | Good 11.1% |