Scottish vs Immigrants from Peru 2 or more Vehicles in Household
COMPARE
Scottish
Immigrants from Peru
2 or more Vehicles in Household
2 or more Vehicles in Household Comparison
Scottish
Immigrants from Peru
61.2%
2 OR MORE VEHICLES IN HOUSEHOLD
100.0/ 100
METRIC RATING
19th/ 347
METRIC RANK
54.4%
2 OR MORE VEHICLES IN HOUSEHOLD
14.3/ 100
METRIC RATING
203rd/ 347
METRIC RANK
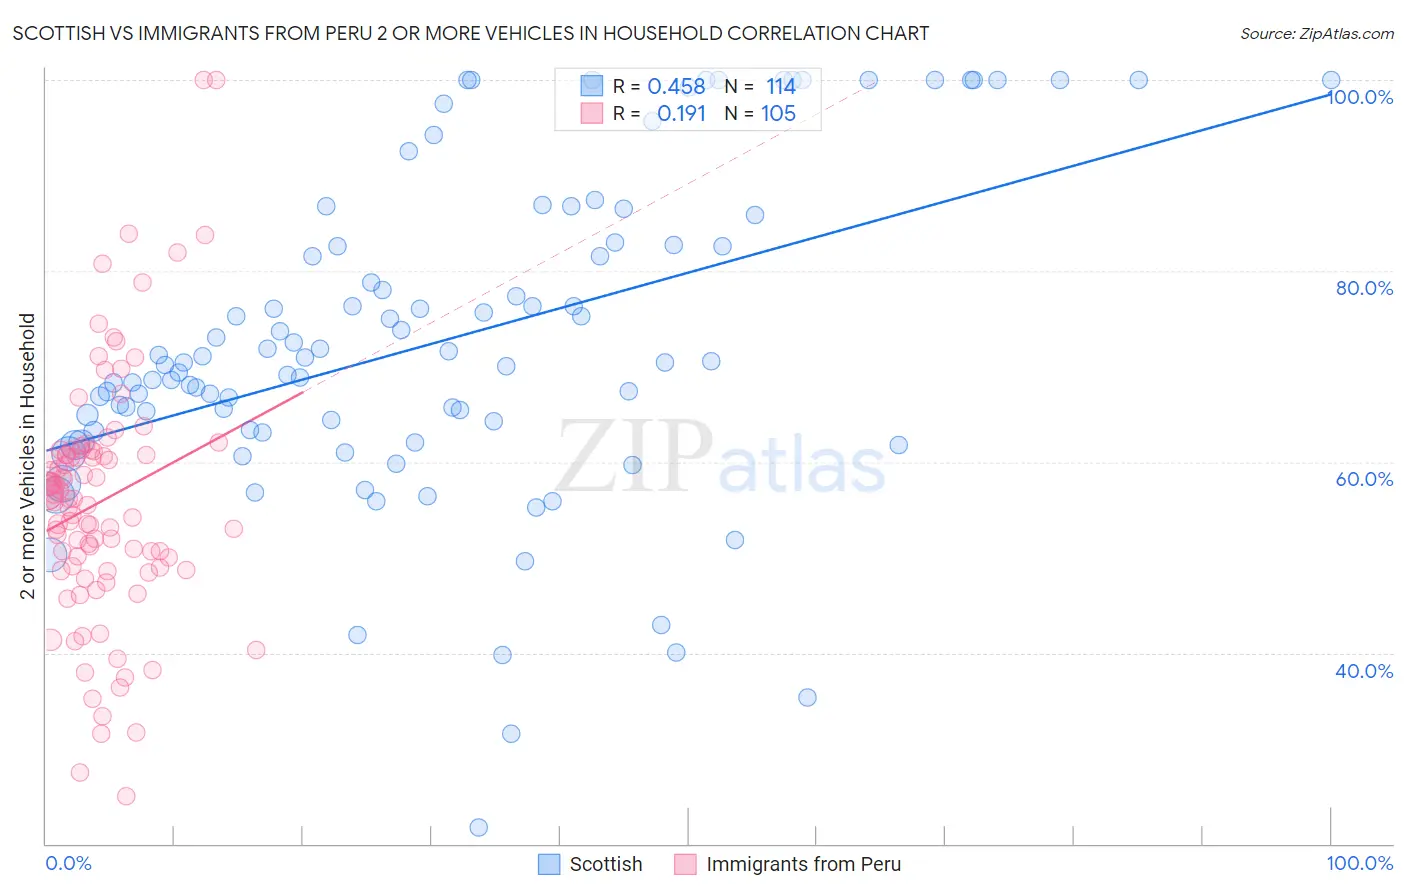
Scottish vs Immigrants from Peru 2 or more Vehicles in Household Correlation Chart
The statistical analysis conducted on geographies consisting of 566,626,490 people shows a moderate positive correlation between the proportion of Scottish and percentage of households with 2 or more vehicles available in the United States with a correlation coefficient (R) of 0.458 and weighted average of 61.2%. Similarly, the statistical analysis conducted on geographies consisting of 328,775,084 people shows a poor positive correlation between the proportion of Immigrants from Peru and percentage of households with 2 or more vehicles available in the United States with a correlation coefficient (R) of 0.191 and weighted average of 54.4%, a difference of 12.6%.
2 or more Vehicles in Household Correlation Summary
| Measurement | Scottish | Immigrants from Peru |
| Minimum | 21.7% | 24.9% |
| Maximum | 100.0% | 100.0% |
| Range | 78.3% | 75.1% |
| Mean | 72.7% | 55.9% |
| Median | 70.5% | 56.1% |
| Interquartile 25% (IQ1) | 63.2% | 48.8% |
| Interquartile 75% (IQ3) | 82.8% | 61.2% |
| Interquartile Range (IQR) | 19.6% | 12.4% |
| Standard Deviation (Sample) | 16.9% | 13.0% |
| Standard Deviation (Population) | 16.8% | 13.0% |
Similar Demographics by 2 or more Vehicles in Household
Demographics Similar to Scottish by 2 or more Vehicles in Household
In terms of 2 or more vehicles in household, the demographic groups most similar to Scottish are European (61.4%, a difference of 0.20%), Basque (61.4%, a difference of 0.22%), Native Hawaiian (61.4%, a difference of 0.28%), Nepalese (61.4%, a difference of 0.31%), and Sri Lankan (61.0%, a difference of 0.35%).
| Demographics | Rating | Rank | 2 or more Vehicles in Household |
| Germans | 100.0 /100 | #12 | Exceptional 61.6% |
| Samoans | 100.0 /100 | #13 | Exceptional 61.5% |
| Czechs | 100.0 /100 | #14 | Exceptional 61.5% |
| Nepalese | 100.0 /100 | #15 | Exceptional 61.4% |
| Native Hawaiians | 100.0 /100 | #16 | Exceptional 61.4% |
| Basques | 100.0 /100 | #17 | Exceptional 61.4% |
| Europeans | 100.0 /100 | #18 | Exceptional 61.4% |
| Scottish | 100.0 /100 | #19 | Exceptional 61.2% |
| Sri Lankans | 100.0 /100 | #20 | Exceptional 61.0% |
| Koreans | 100.0 /100 | #21 | Exceptional 61.0% |
| Swiss | 100.0 /100 | #22 | Exceptional 61.0% |
| Scotch-Irish | 100.0 /100 | #23 | Exceptional 60.9% |
| Immigrants | Vietnam | 100.0 /100 | #24 | Exceptional 60.9% |
| Whites/Caucasians | 100.0 /100 | #25 | Exceptional 60.8% |
| Welsh | 100.0 /100 | #26 | Exceptional 60.8% |
Demographics Similar to Immigrants from Peru by 2 or more Vehicles in Household
In terms of 2 or more vehicles in household, the demographic groups most similar to Immigrants from Peru are Immigrants from North Macedonia (54.4%, a difference of 0.040%), Immigrants from Belgium (54.3%, a difference of 0.050%), Cheyenne (54.3%, a difference of 0.060%), Immigrants from Italy (54.4%, a difference of 0.090%), and Immigrants from Latin America (54.3%, a difference of 0.11%).
| Demographics | Rating | Rank | 2 or more Vehicles in Household |
| Immigrants | Poland | 19.3 /100 | #196 | Poor 54.6% |
| Argentineans | 17.5 /100 | #197 | Poor 54.5% |
| Carpatho Rusyns | 16.2 /100 | #198 | Poor 54.4% |
| Immigrants | Norway | 15.9 /100 | #199 | Poor 54.4% |
| Houma | 15.8 /100 | #200 | Poor 54.4% |
| Immigrants | Italy | 15.5 /100 | #201 | Poor 54.4% |
| Immigrants | North Macedonia | 14.9 /100 | #202 | Poor 54.4% |
| Immigrants | Peru | 14.3 /100 | #203 | Poor 54.4% |
| Immigrants | Belgium | 13.7 /100 | #204 | Poor 54.3% |
| Cheyenne | 13.6 /100 | #205 | Poor 54.3% |
| Immigrants | Latin America | 13.1 /100 | #206 | Poor 54.3% |
| Turks | 13.0 /100 | #207 | Poor 54.3% |
| Egyptians | 12.0 /100 | #208 | Poor 54.3% |
| Immigrants | Bulgaria | 12.0 /100 | #209 | Poor 54.3% |
| Immigrants | Saudi Arabia | 11.3 /100 | #210 | Poor 54.2% |