Scottish vs Central American Indian 2 or more Vehicles in Household
COMPARE
Scottish
Central American Indian
2 or more Vehicles in Household
2 or more Vehicles in Household Comparison
Scottish
Central American Indians
61.2%
2 OR MORE VEHICLES IN HOUSEHOLD
100.0/ 100
METRIC RATING
19th/ 347
METRIC RANK
52.5%
2 OR MORE VEHICLES IN HOUSEHOLD
0.6/ 100
METRIC RATING
258th/ 347
METRIC RANK
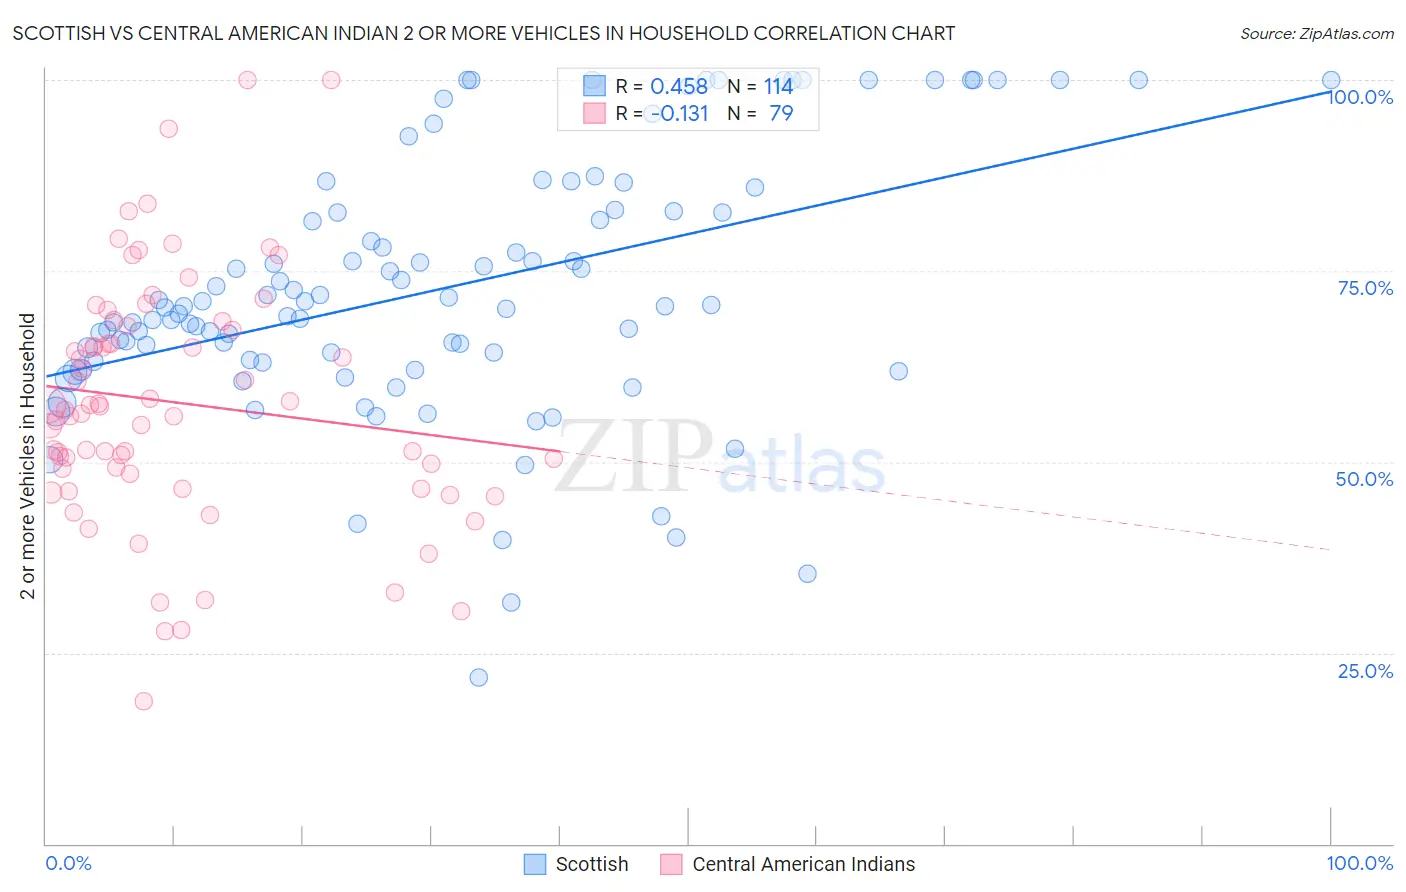
Scottish vs Central American Indian 2 or more Vehicles in Household Correlation Chart
The statistical analysis conducted on geographies consisting of 566,626,490 people shows a moderate positive correlation between the proportion of Scottish and percentage of households with 2 or more vehicles available in the United States with a correlation coefficient (R) of 0.458 and weighted average of 61.2%. Similarly, the statistical analysis conducted on geographies consisting of 326,069,304 people shows a poor negative correlation between the proportion of Central American Indians and percentage of households with 2 or more vehicles available in the United States with a correlation coefficient (R) of -0.131 and weighted average of 52.5%, a difference of 16.6%.
2 or more Vehicles in Household Correlation Summary
| Measurement | Scottish | Central American Indian |
| Minimum | 21.7% | 18.7% |
| Maximum | 100.0% | 100.0% |
| Range | 78.3% | 81.3% |
| Mean | 72.7% | 57.8% |
| Median | 70.5% | 56.8% |
| Interquartile 25% (IQ1) | 63.2% | 48.5% |
| Interquartile 75% (IQ3) | 82.8% | 67.8% |
| Interquartile Range (IQR) | 19.6% | 19.3% |
| Standard Deviation (Sample) | 16.9% | 16.0% |
| Standard Deviation (Population) | 16.8% | 15.9% |
Similar Demographics by 2 or more Vehicles in Household
Demographics Similar to Scottish by 2 or more Vehicles in Household
In terms of 2 or more vehicles in household, the demographic groups most similar to Scottish are European (61.4%, a difference of 0.20%), Basque (61.4%, a difference of 0.22%), Native Hawaiian (61.4%, a difference of 0.28%), Nepalese (61.4%, a difference of 0.31%), and Sri Lankan (61.0%, a difference of 0.35%).
| Demographics | Rating | Rank | 2 or more Vehicles in Household |
| Germans | 100.0 /100 | #12 | Exceptional 61.6% |
| Samoans | 100.0 /100 | #13 | Exceptional 61.5% |
| Czechs | 100.0 /100 | #14 | Exceptional 61.5% |
| Nepalese | 100.0 /100 | #15 | Exceptional 61.4% |
| Native Hawaiians | 100.0 /100 | #16 | Exceptional 61.4% |
| Basques | 100.0 /100 | #17 | Exceptional 61.4% |
| Europeans | 100.0 /100 | #18 | Exceptional 61.4% |
| Scottish | 100.0 /100 | #19 | Exceptional 61.2% |
| Sri Lankans | 100.0 /100 | #20 | Exceptional 61.0% |
| Koreans | 100.0 /100 | #21 | Exceptional 61.0% |
| Swiss | 100.0 /100 | #22 | Exceptional 61.0% |
| Scotch-Irish | 100.0 /100 | #23 | Exceptional 60.9% |
| Immigrants | Vietnam | 100.0 /100 | #24 | Exceptional 60.9% |
| Whites/Caucasians | 100.0 /100 | #25 | Exceptional 60.8% |
| Welsh | 100.0 /100 | #26 | Exceptional 60.8% |
Demographics Similar to Central American Indians by 2 or more Vehicles in Household
In terms of 2 or more vehicles in household, the demographic groups most similar to Central American Indians are Alsatian (52.5%, a difference of 0.040%), Immigrants from Hong Kong (52.6%, a difference of 0.10%), Immigrants from Bahamas (52.5%, a difference of 0.10%), Immigrants from Australia (52.4%, a difference of 0.14%), and Immigrants from Eritrea (52.6%, a difference of 0.24%).
| Demographics | Rating | Rank | 2 or more Vehicles in Household |
| Immigrants | Sudan | 1.0 /100 | #251 | Tragic 52.8% |
| Immigrants | Portugal | 1.0 /100 | #252 | Tragic 52.8% |
| Nigerians | 0.9 /100 | #253 | Tragic 52.8% |
| Immigrants | Malaysia | 0.8 /100 | #254 | Tragic 52.7% |
| Uruguayans | 0.7 /100 | #255 | Tragic 52.7% |
| Immigrants | Eritrea | 0.7 /100 | #256 | Tragic 52.6% |
| Immigrants | Hong Kong | 0.6 /100 | #257 | Tragic 52.6% |
| Central American Indians | 0.6 /100 | #258 | Tragic 52.5% |
| Alsatians | 0.6 /100 | #259 | Tragic 52.5% |
| Immigrants | Bahamas | 0.5 /100 | #260 | Tragic 52.5% |
| Immigrants | Australia | 0.5 /100 | #261 | Tragic 52.4% |
| Immigrants | Northern Africa | 0.4 /100 | #262 | Tragic 52.3% |
| Immigrants | Southern Europe | 0.4 /100 | #263 | Tragic 52.3% |
| Immigrants | Latvia | 0.4 /100 | #264 | Tragic 52.2% |
| Immigrants | Congo | 0.3 /100 | #265 | Tragic 52.1% |