Scottish vs Immigrants from Zimbabwe 2 or more Vehicles in Household
COMPARE
Scottish
Immigrants from Zimbabwe
2 or more Vehicles in Household
2 or more Vehicles in Household Comparison
Scottish
Immigrants from Zimbabwe
61.2%
2 OR MORE VEHICLES IN HOUSEHOLD
100.0/ 100
METRIC RATING
19th/ 347
METRIC RANK
55.6%
2 OR MORE VEHICLES IN HOUSEHOLD
60.2/ 100
METRIC RATING
163rd/ 347
METRIC RANK
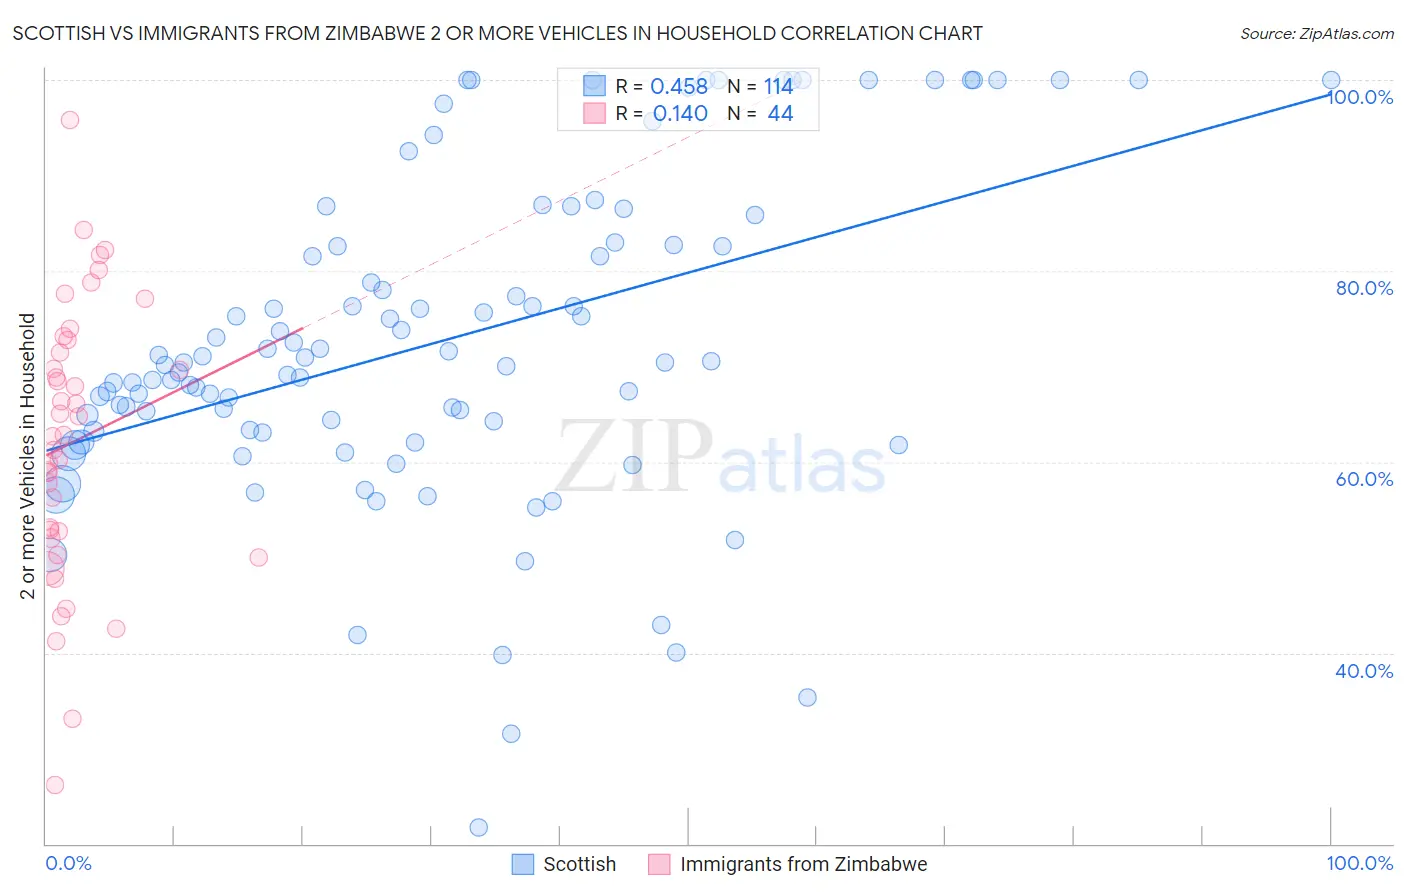
Scottish vs Immigrants from Zimbabwe 2 or more Vehicles in Household Correlation Chart
The statistical analysis conducted on geographies consisting of 566,626,490 people shows a moderate positive correlation between the proportion of Scottish and percentage of households with 2 or more vehicles available in the United States with a correlation coefficient (R) of 0.458 and weighted average of 61.2%. Similarly, the statistical analysis conducted on geographies consisting of 117,791,116 people shows a poor positive correlation between the proportion of Immigrants from Zimbabwe and percentage of households with 2 or more vehicles available in the United States with a correlation coefficient (R) of 0.140 and weighted average of 55.6%, a difference of 10.2%.
2 or more Vehicles in Household Correlation Summary
| Measurement | Scottish | Immigrants from Zimbabwe |
| Minimum | 21.7% | 26.1% |
| Maximum | 100.0% | 95.8% |
| Range | 78.3% | 69.7% |
| Mean | 72.7% | 62.1% |
| Median | 70.5% | 62.8% |
| Interquartile 25% (IQ1) | 63.2% | 52.4% |
| Interquartile 75% (IQ3) | 82.8% | 72.1% |
| Interquartile Range (IQR) | 19.6% | 19.7% |
| Standard Deviation (Sample) | 16.9% | 14.4% |
| Standard Deviation (Population) | 16.8% | 14.2% |
Similar Demographics by 2 or more Vehicles in Household
Demographics Similar to Scottish by 2 or more Vehicles in Household
In terms of 2 or more vehicles in household, the demographic groups most similar to Scottish are European (61.4%, a difference of 0.20%), Basque (61.4%, a difference of 0.22%), Native Hawaiian (61.4%, a difference of 0.28%), Nepalese (61.4%, a difference of 0.31%), and Sri Lankan (61.0%, a difference of 0.35%).
| Demographics | Rating | Rank | 2 or more Vehicles in Household |
| Germans | 100.0 /100 | #12 | Exceptional 61.6% |
| Samoans | 100.0 /100 | #13 | Exceptional 61.5% |
| Czechs | 100.0 /100 | #14 | Exceptional 61.5% |
| Nepalese | 100.0 /100 | #15 | Exceptional 61.4% |
| Native Hawaiians | 100.0 /100 | #16 | Exceptional 61.4% |
| Basques | 100.0 /100 | #17 | Exceptional 61.4% |
| Europeans | 100.0 /100 | #18 | Exceptional 61.4% |
| Scottish | 100.0 /100 | #19 | Exceptional 61.2% |
| Sri Lankans | 100.0 /100 | #20 | Exceptional 61.0% |
| Koreans | 100.0 /100 | #21 | Exceptional 61.0% |
| Swiss | 100.0 /100 | #22 | Exceptional 61.0% |
| Scotch-Irish | 100.0 /100 | #23 | Exceptional 60.9% |
| Immigrants | Vietnam | 100.0 /100 | #24 | Exceptional 60.9% |
| Whites/Caucasians | 100.0 /100 | #25 | Exceptional 60.8% |
| Welsh | 100.0 /100 | #26 | Exceptional 60.8% |
Demographics Similar to Immigrants from Zimbabwe by 2 or more Vehicles in Household
In terms of 2 or more vehicles in household, the demographic groups most similar to Immigrants from Zimbabwe are Dutch West Indian (55.6%, a difference of 0.010%), German Russian (55.6%, a difference of 0.030%), Immigrants from El Salvador (55.6%, a difference of 0.030%), Colville (55.6%, a difference of 0.040%), and Immigrants from Sri Lanka (55.5%, a difference of 0.080%).
| Demographics | Rating | Rank | 2 or more Vehicles in Household |
| Immigrants | Lithuania | 70.4 /100 | #156 | Good 55.8% |
| Immigrants | Kuwait | 70.2 /100 | #157 | Good 55.8% |
| Tlingit-Haida | 68.5 /100 | #158 | Good 55.8% |
| Paiute | 68.0 /100 | #159 | Good 55.8% |
| Crow | 67.0 /100 | #160 | Good 55.7% |
| Colville | 61.1 /100 | #161 | Good 55.6% |
| German Russians | 60.9 /100 | #162 | Good 55.6% |
| Immigrants | Zimbabwe | 60.2 /100 | #163 | Good 55.6% |
| Dutch West Indians | 59.8 /100 | #164 | Average 55.6% |
| Immigrants | El Salvador | 59.4 /100 | #165 | Average 55.6% |
| Immigrants | Sri Lanka | 58.3 /100 | #166 | Average 55.5% |
| Kenyans | 58.1 /100 | #167 | Average 55.5% |
| French American Indians | 56.7 /100 | #168 | Average 55.5% |
| Immigrants | Austria | 56.3 /100 | #169 | Average 55.5% |
| Romanians | 55.8 /100 | #170 | Average 55.5% |