Scottish vs Iraqi 2 or more Vehicles in Household
COMPARE
Scottish
Iraqi
2 or more Vehicles in Household
2 or more Vehicles in Household Comparison
Scottish
Iraqis
61.2%
2 OR MORE VEHICLES IN HOUSEHOLD
100.0/ 100
METRIC RATING
19th/ 347
METRIC RANK
57.1%
2 OR MORE VEHICLES IN HOUSEHOLD
95.8/ 100
METRIC RATING
117th/ 347
METRIC RANK
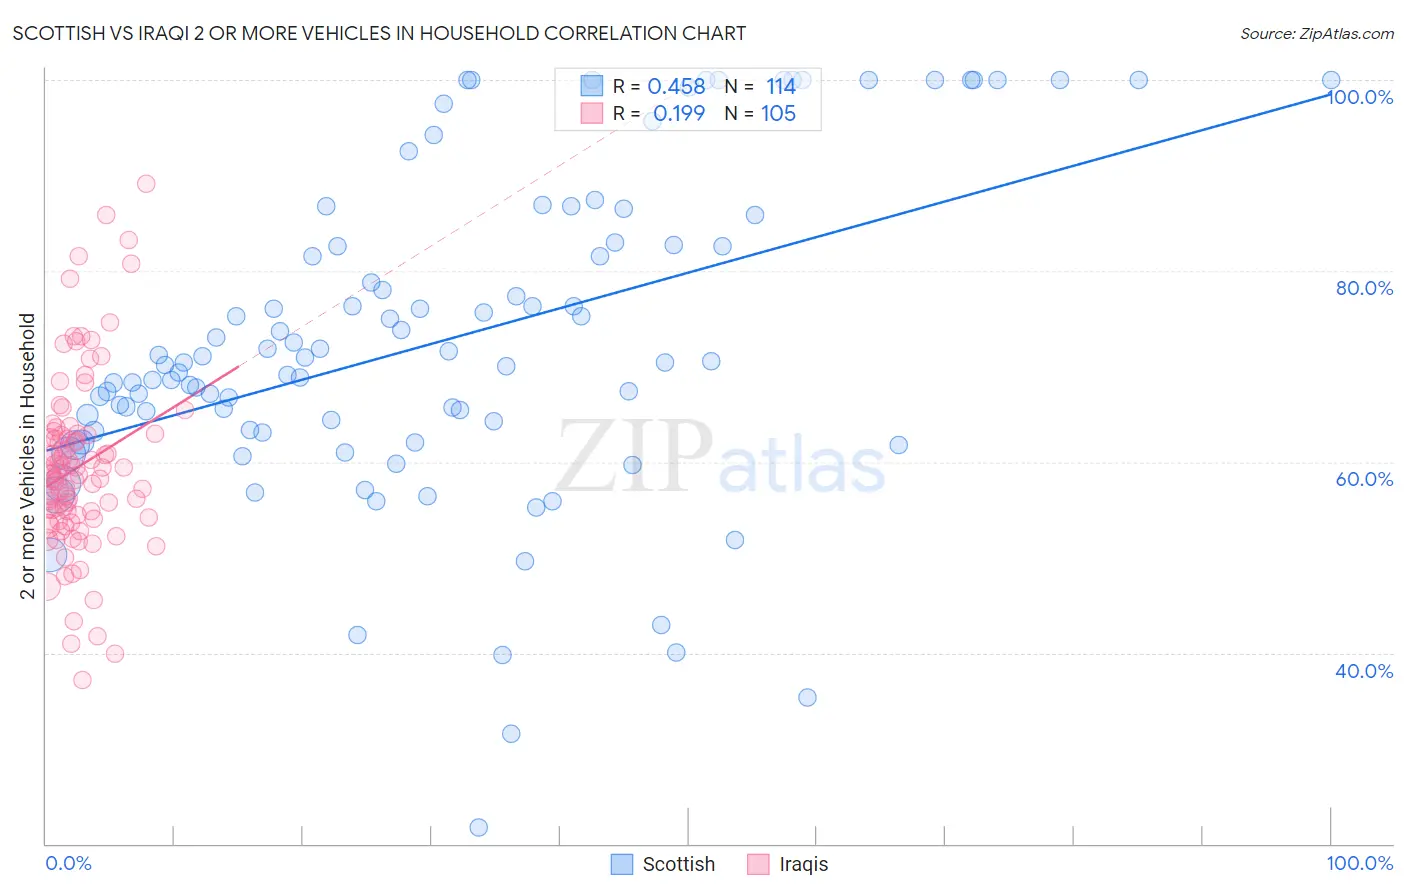
Scottish vs Iraqi 2 or more Vehicles in Household Correlation Chart
The statistical analysis conducted on geographies consisting of 566,626,490 people shows a moderate positive correlation between the proportion of Scottish and percentage of households with 2 or more vehicles available in the United States with a correlation coefficient (R) of 0.458 and weighted average of 61.2%. Similarly, the statistical analysis conducted on geographies consisting of 170,650,465 people shows a poor positive correlation between the proportion of Iraqis and percentage of households with 2 or more vehicles available in the United States with a correlation coefficient (R) of 0.199 and weighted average of 57.1%, a difference of 7.3%.
2 or more Vehicles in Household Correlation Summary
| Measurement | Scottish | Iraqi |
| Minimum | 21.7% | 37.2% |
| Maximum | 100.0% | 89.1% |
| Range | 78.3% | 51.9% |
| Mean | 72.7% | 59.5% |
| Median | 70.5% | 58.7% |
| Interquartile 25% (IQ1) | 63.2% | 54.1% |
| Interquartile 75% (IQ3) | 82.8% | 62.9% |
| Interquartile Range (IQR) | 19.6% | 8.7% |
| Standard Deviation (Sample) | 16.9% | 9.3% |
| Standard Deviation (Population) | 16.8% | 9.3% |
Similar Demographics by 2 or more Vehicles in Household
Demographics Similar to Scottish by 2 or more Vehicles in Household
In terms of 2 or more vehicles in household, the demographic groups most similar to Scottish are European (61.4%, a difference of 0.20%), Basque (61.4%, a difference of 0.22%), Native Hawaiian (61.4%, a difference of 0.28%), Nepalese (61.4%, a difference of 0.31%), and Sri Lankan (61.0%, a difference of 0.35%).
| Demographics | Rating | Rank | 2 or more Vehicles in Household |
| Germans | 100.0 /100 | #12 | Exceptional 61.6% |
| Samoans | 100.0 /100 | #13 | Exceptional 61.5% |
| Czechs | 100.0 /100 | #14 | Exceptional 61.5% |
| Nepalese | 100.0 /100 | #15 | Exceptional 61.4% |
| Native Hawaiians | 100.0 /100 | #16 | Exceptional 61.4% |
| Basques | 100.0 /100 | #17 | Exceptional 61.4% |
| Europeans | 100.0 /100 | #18 | Exceptional 61.4% |
| Scottish | 100.0 /100 | #19 | Exceptional 61.2% |
| Sri Lankans | 100.0 /100 | #20 | Exceptional 61.0% |
| Koreans | 100.0 /100 | #21 | Exceptional 61.0% |
| Swiss | 100.0 /100 | #22 | Exceptional 61.0% |
| Scotch-Irish | 100.0 /100 | #23 | Exceptional 60.9% |
| Immigrants | Vietnam | 100.0 /100 | #24 | Exceptional 60.9% |
| Whites/Caucasians | 100.0 /100 | #25 | Exceptional 60.8% |
| Welsh | 100.0 /100 | #26 | Exceptional 60.8% |
Demographics Similar to Iraqis by 2 or more Vehicles in Household
In terms of 2 or more vehicles in household, the demographic groups most similar to Iraqis are Asian (57.0%, a difference of 0.16%), Immigrants from Jordan (57.2%, a difference of 0.19%), Native/Alaskan (57.0%, a difference of 0.19%), Chippewa (57.2%, a difference of 0.20%), and Costa Rican (56.9%, a difference of 0.24%).
| Demographics | Rating | Rank | 2 or more Vehicles in Household |
| Japanese | 98.0 /100 | #110 | Exceptional 57.5% |
| Greeks | 98.0 /100 | #111 | Exceptional 57.5% |
| Pueblo | 98.0 /100 | #112 | Exceptional 57.5% |
| Zimbabweans | 96.9 /100 | #113 | Exceptional 57.2% |
| Immigrants | Lebanon | 96.8 /100 | #114 | Exceptional 57.2% |
| Chippewa | 96.6 /100 | #115 | Exceptional 57.2% |
| Immigrants | Jordan | 96.6 /100 | #116 | Exceptional 57.2% |
| Iraqis | 95.8 /100 | #117 | Exceptional 57.1% |
| Asians | 95.1 /100 | #118 | Exceptional 57.0% |
| Natives/Alaskans | 95.0 /100 | #119 | Exceptional 57.0% |
| Costa Ricans | 94.7 /100 | #120 | Exceptional 56.9% |
| Sioux | 93.8 /100 | #121 | Exceptional 56.8% |
| Immigrants | South Africa | 92.5 /100 | #122 | Exceptional 56.7% |
| Australians | 91.8 /100 | #123 | Exceptional 56.7% |
| New Zealanders | 91.8 /100 | #124 | Exceptional 56.7% |