Scottish vs Paraguayan 2 or more Vehicles in Household
COMPARE
Scottish
Paraguayan
2 or more Vehicles in Household
2 or more Vehicles in Household Comparison
Scottish
Paraguayans
61.2%
2 OR MORE VEHICLES IN HOUSEHOLD
100.0/ 100
METRIC RATING
19th/ 347
METRIC RANK
50.3%
2 OR MORE VEHICLES IN HOUSEHOLD
0.0/ 100
METRIC RATING
298th/ 347
METRIC RANK
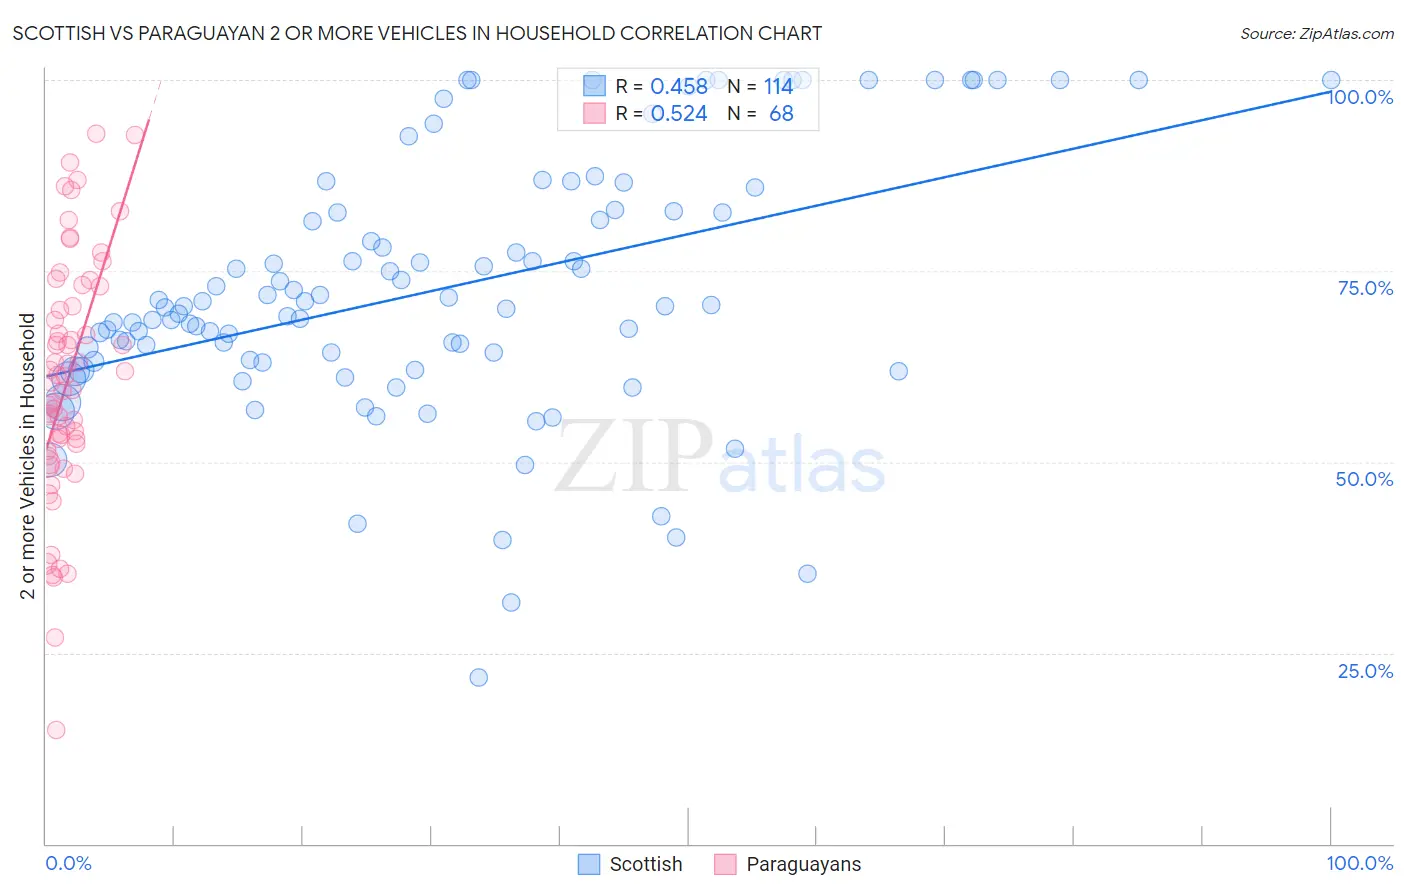
Scottish vs Paraguayan 2 or more Vehicles in Household Correlation Chart
The statistical analysis conducted on geographies consisting of 566,626,490 people shows a moderate positive correlation between the proportion of Scottish and percentage of households with 2 or more vehicles available in the United States with a correlation coefficient (R) of 0.458 and weighted average of 61.2%. Similarly, the statistical analysis conducted on geographies consisting of 95,096,913 people shows a substantial positive correlation between the proportion of Paraguayans and percentage of households with 2 or more vehicles available in the United States with a correlation coefficient (R) of 0.524 and weighted average of 50.3%, a difference of 21.6%.
2 or more Vehicles in Household Correlation Summary
| Measurement | Scottish | Paraguayan |
| Minimum | 21.7% | 15.0% |
| Maximum | 100.0% | 93.0% |
| Range | 78.3% | 78.0% |
| Mean | 72.7% | 60.7% |
| Median | 70.5% | 60.8% |
| Interquartile 25% (IQ1) | 63.2% | 52.0% |
| Interquartile 75% (IQ3) | 82.8% | 71.7% |
| Interquartile Range (IQR) | 19.6% | 19.7% |
| Standard Deviation (Sample) | 16.9% | 16.0% |
| Standard Deviation (Population) | 16.8% | 15.8% |
Similar Demographics by 2 or more Vehicles in Household
Demographics Similar to Scottish by 2 or more Vehicles in Household
In terms of 2 or more vehicles in household, the demographic groups most similar to Scottish are European (61.4%, a difference of 0.20%), Basque (61.4%, a difference of 0.22%), Native Hawaiian (61.4%, a difference of 0.28%), Nepalese (61.4%, a difference of 0.31%), and Sri Lankan (61.0%, a difference of 0.35%).
| Demographics | Rating | Rank | 2 or more Vehicles in Household |
| Germans | 100.0 /100 | #12 | Exceptional 61.6% |
| Samoans | 100.0 /100 | #13 | Exceptional 61.5% |
| Czechs | 100.0 /100 | #14 | Exceptional 61.5% |
| Nepalese | 100.0 /100 | #15 | Exceptional 61.4% |
| Native Hawaiians | 100.0 /100 | #16 | Exceptional 61.4% |
| Basques | 100.0 /100 | #17 | Exceptional 61.4% |
| Europeans | 100.0 /100 | #18 | Exceptional 61.4% |
| Scottish | 100.0 /100 | #19 | Exceptional 61.2% |
| Sri Lankans | 100.0 /100 | #20 | Exceptional 61.0% |
| Koreans | 100.0 /100 | #21 | Exceptional 61.0% |
| Swiss | 100.0 /100 | #22 | Exceptional 61.0% |
| Scotch-Irish | 100.0 /100 | #23 | Exceptional 60.9% |
| Immigrants | Vietnam | 100.0 /100 | #24 | Exceptional 60.9% |
| Whites/Caucasians | 100.0 /100 | #25 | Exceptional 60.8% |
| Welsh | 100.0 /100 | #26 | Exceptional 60.8% |
Demographics Similar to Paraguayans by 2 or more Vehicles in Household
In terms of 2 or more vehicles in household, the demographic groups most similar to Paraguayans are Immigrants from Morocco (50.3%, a difference of 0.030%), Immigrants from Russia (50.3%, a difference of 0.070%), Immigrants from Spain (50.4%, a difference of 0.13%), Immigrants from Greece (50.2%, a difference of 0.25%), and Immigrants from South America (50.2%, a difference of 0.31%).
| Demographics | Rating | Rank | 2 or more Vehicles in Household |
| Belizeans | 0.0 /100 | #291 | Tragic 51.0% |
| Immigrants | Ukraine | 0.0 /100 | #292 | Tragic 50.9% |
| Blacks/African Americans | 0.0 /100 | #293 | Tragic 50.9% |
| Bermudans | 0.0 /100 | #294 | Tragic 50.6% |
| Cypriots | 0.0 /100 | #295 | Tragic 50.6% |
| Immigrants | Somalia | 0.0 /100 | #296 | Tragic 50.5% |
| Immigrants | Spain | 0.0 /100 | #297 | Tragic 50.4% |
| Paraguayans | 0.0 /100 | #298 | Tragic 50.3% |
| Immigrants | Morocco | 0.0 /100 | #299 | Tragic 50.3% |
| Immigrants | Russia | 0.0 /100 | #300 | Tragic 50.3% |
| Immigrants | Greece | 0.0 /100 | #301 | Tragic 50.2% |
| Immigrants | South America | 0.0 /100 | #302 | Tragic 50.2% |
| Tohono O'odham | 0.0 /100 | #303 | Tragic 50.0% |
| Immigrants | Belize | 0.0 /100 | #304 | Tragic 49.9% |
| Immigrants | Western Africa | 0.0 /100 | #305 | Tragic 49.4% |