Choctaw vs Immigrants from Peru 2 or more Vehicles in Household
COMPARE
Choctaw
Immigrants from Peru
2 or more Vehicles in Household
2 or more Vehicles in Household Comparison
Choctaw
Immigrants from Peru
59.3%
2 OR MORE VEHICLES IN HOUSEHOLD
99.9/ 100
METRIC RATING
50th/ 347
METRIC RANK
54.4%
2 OR MORE VEHICLES IN HOUSEHOLD
14.3/ 100
METRIC RATING
203rd/ 347
METRIC RANK
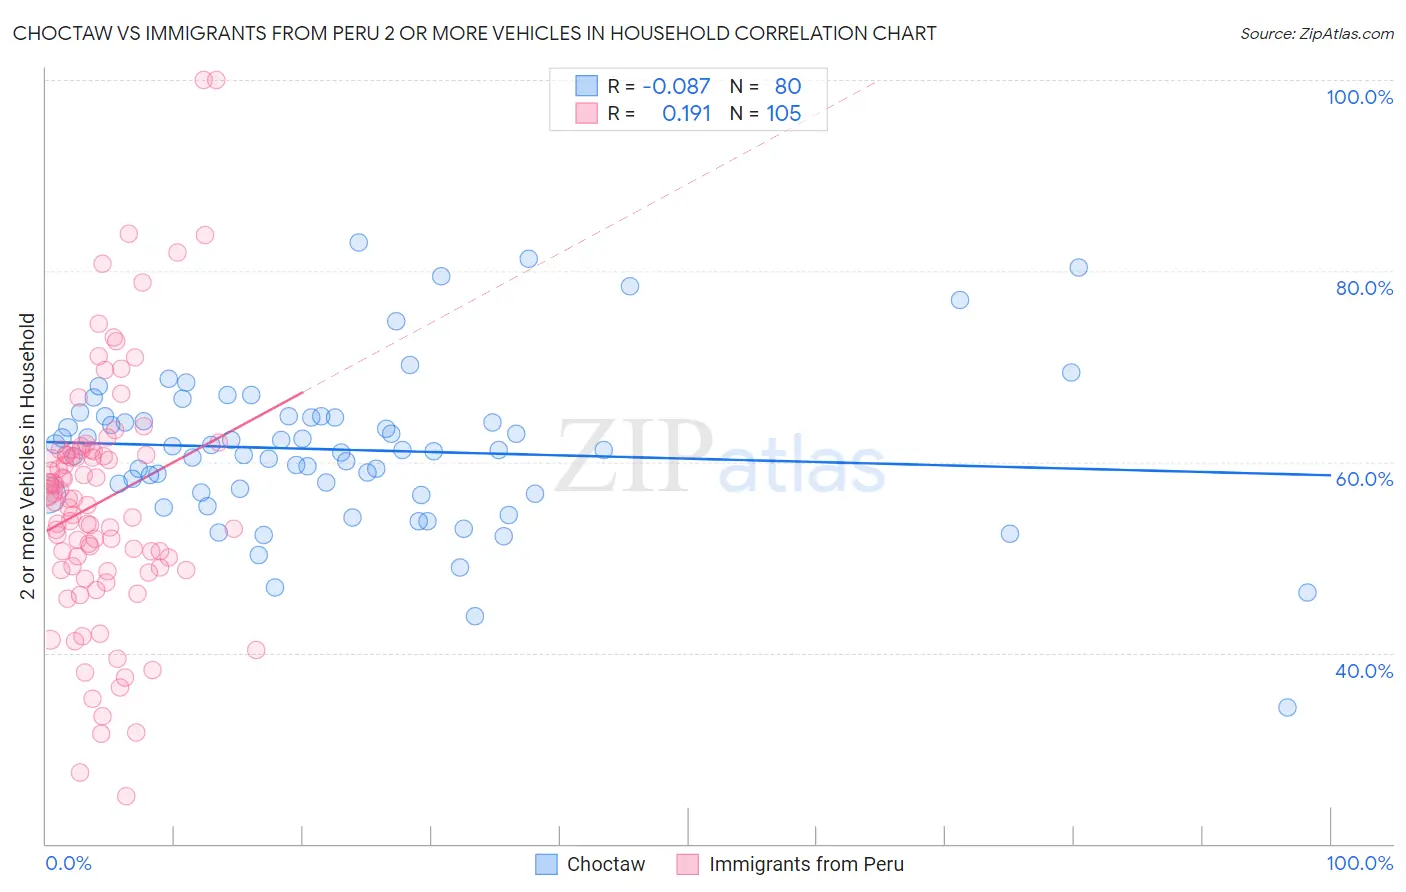
Choctaw vs Immigrants from Peru 2 or more Vehicles in Household Correlation Chart
The statistical analysis conducted on geographies consisting of 269,636,757 people shows a slight negative correlation between the proportion of Choctaw and percentage of households with 2 or more vehicles available in the United States with a correlation coefficient (R) of -0.087 and weighted average of 59.3%. Similarly, the statistical analysis conducted on geographies consisting of 328,775,084 people shows a poor positive correlation between the proportion of Immigrants from Peru and percentage of households with 2 or more vehicles available in the United States with a correlation coefficient (R) of 0.191 and weighted average of 54.4%, a difference of 9.0%.
2 or more Vehicles in Household Correlation Summary
| Measurement | Choctaw | Immigrants from Peru |
| Minimum | 34.2% | 24.9% |
| Maximum | 83.0% | 100.0% |
| Range | 48.7% | 75.1% |
| Mean | 61.3% | 55.9% |
| Median | 61.3% | 56.1% |
| Interquartile 25% (IQ1) | 56.7% | 48.8% |
| Interquartile 75% (IQ3) | 64.7% | 61.2% |
| Interquartile Range (IQR) | 8.0% | 12.4% |
| Standard Deviation (Sample) | 8.3% | 13.0% |
| Standard Deviation (Population) | 8.2% | 13.0% |
Similar Demographics by 2 or more Vehicles in Household
Demographics Similar to Choctaw by 2 or more Vehicles in Household
In terms of 2 or more vehicles in household, the demographic groups most similar to Choctaw are Belgian (59.3%, a difference of 0.010%), Immigrants from India (59.3%, a difference of 0.040%), Yaqui (59.3%, a difference of 0.060%), Spaniard (59.2%, a difference of 0.14%), and Immigrants from Laos (59.2%, a difference of 0.14%).
| Demographics | Rating | Rank | 2 or more Vehicles in Household |
| Czechoslovakians | 100.0 /100 | #43 | Exceptional 59.8% |
| French | 100.0 /100 | #44 | Exceptional 59.8% |
| Immigrants | Taiwan | 100.0 /100 | #45 | Exceptional 59.7% |
| Immigrants | South Eastern Asia | 100.0 /100 | #46 | Exceptional 59.6% |
| Yaqui | 99.9 /100 | #47 | Exceptional 59.3% |
| Immigrants | India | 99.9 /100 | #48 | Exceptional 59.3% |
| Belgians | 99.9 /100 | #49 | Exceptional 59.3% |
| Choctaw | 99.9 /100 | #50 | Exceptional 59.3% |
| Spaniards | 99.9 /100 | #51 | Exceptional 59.2% |
| Immigrants | Laos | 99.9 /100 | #52 | Exceptional 59.2% |
| Celtics | 99.9 /100 | #53 | Exceptional 59.2% |
| Bhutanese | 99.9 /100 | #54 | Exceptional 59.1% |
| Luxembourgers | 99.9 /100 | #55 | Exceptional 59.1% |
| Chickasaw | 99.9 /100 | #56 | Exceptional 59.0% |
| Afghans | 99.9 /100 | #57 | Exceptional 59.0% |
Demographics Similar to Immigrants from Peru by 2 or more Vehicles in Household
In terms of 2 or more vehicles in household, the demographic groups most similar to Immigrants from Peru are Immigrants from North Macedonia (54.4%, a difference of 0.040%), Immigrants from Belgium (54.3%, a difference of 0.050%), Cheyenne (54.3%, a difference of 0.060%), Immigrants from Italy (54.4%, a difference of 0.090%), and Immigrants from Latin America (54.3%, a difference of 0.11%).
| Demographics | Rating | Rank | 2 or more Vehicles in Household |
| Immigrants | Poland | 19.3 /100 | #196 | Poor 54.6% |
| Argentineans | 17.5 /100 | #197 | Poor 54.5% |
| Carpatho Rusyns | 16.2 /100 | #198 | Poor 54.4% |
| Immigrants | Norway | 15.9 /100 | #199 | Poor 54.4% |
| Houma | 15.8 /100 | #200 | Poor 54.4% |
| Immigrants | Italy | 15.5 /100 | #201 | Poor 54.4% |
| Immigrants | North Macedonia | 14.9 /100 | #202 | Poor 54.4% |
| Immigrants | Peru | 14.3 /100 | #203 | Poor 54.4% |
| Immigrants | Belgium | 13.7 /100 | #204 | Poor 54.3% |
| Cheyenne | 13.6 /100 | #205 | Poor 54.3% |
| Immigrants | Latin America | 13.1 /100 | #206 | Poor 54.3% |
| Turks | 13.0 /100 | #207 | Poor 54.3% |
| Egyptians | 12.0 /100 | #208 | Poor 54.3% |
| Immigrants | Bulgaria | 12.0 /100 | #209 | Poor 54.3% |
| Immigrants | Saudi Arabia | 11.3 /100 | #210 | Poor 54.2% |