Romanian vs Immigrants from Liberia 3 or more Vehicles in Household
COMPARE
Romanian
Immigrants from Liberia
3 or more Vehicles in Household
3 or more Vehicles in Household Comparison
Romanians
Immigrants from Liberia
19.3%
3 OR MORE VEHICLES IN HOUSEHOLD
37.1/ 100
METRIC RATING
181st/ 347
METRIC RANK
17.1%
3 OR MORE VEHICLES IN HOUSEHOLD
0.1/ 100
METRIC RATING
289th/ 347
METRIC RANK
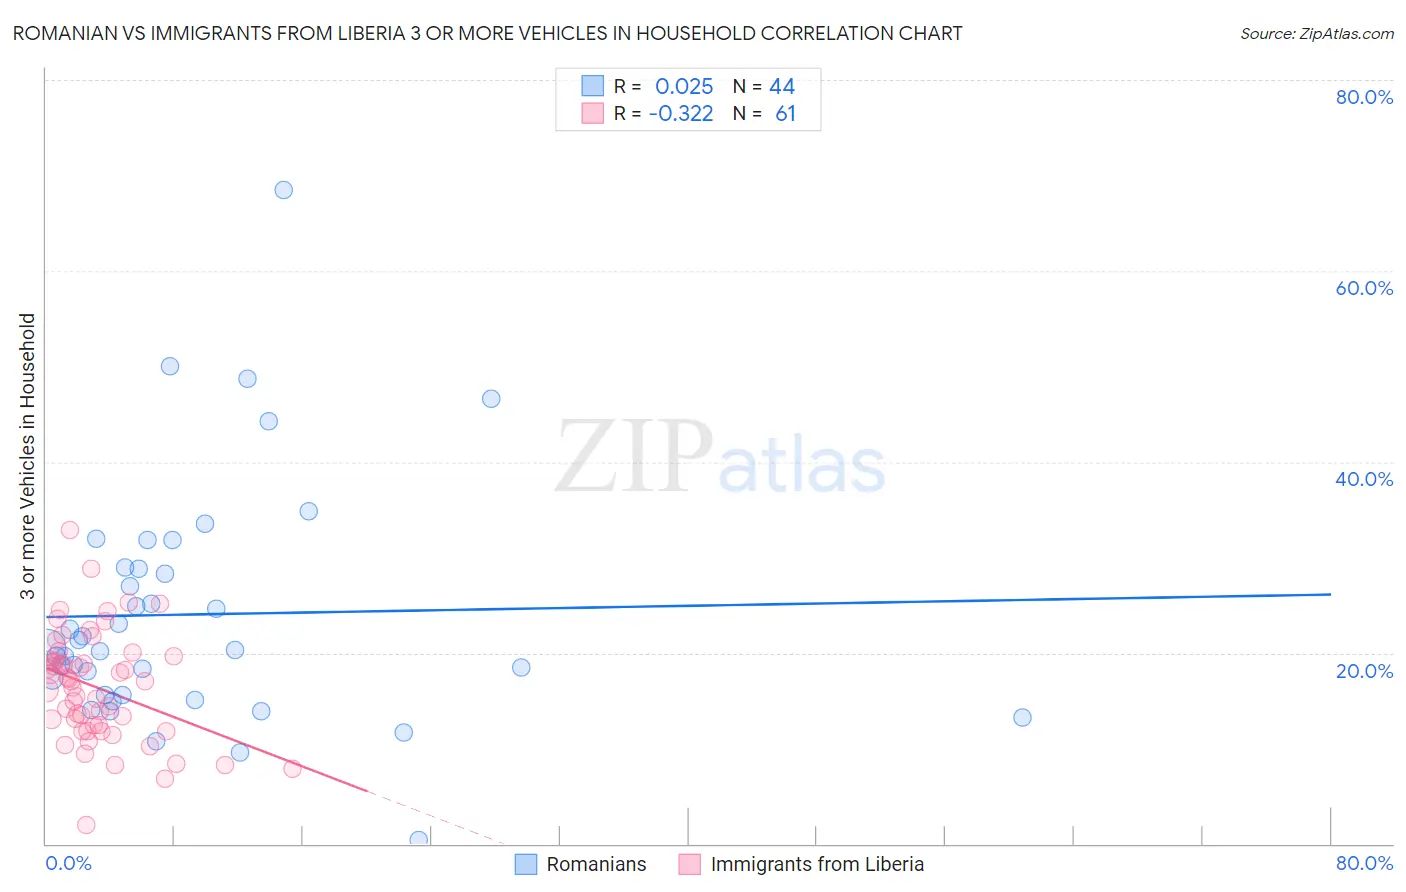
Romanian vs Immigrants from Liberia 3 or more Vehicles in Household Correlation Chart
The statistical analysis conducted on geographies consisting of 377,618,048 people shows no correlation between the proportion of Romanians and percentage of households with 3 or more vehicles available in the United States with a correlation coefficient (R) of 0.025 and weighted average of 19.3%. Similarly, the statistical analysis conducted on geographies consisting of 135,209,335 people shows a mild negative correlation between the proportion of Immigrants from Liberia and percentage of households with 3 or more vehicles available in the United States with a correlation coefficient (R) of -0.322 and weighted average of 17.1%, a difference of 12.9%.
3 or more Vehicles in Household Correlation Summary
| Measurement | Romanian | Immigrants from Liberia |
| Minimum | 0.45% | 2.0% |
| Maximum | 68.5% | 32.8% |
| Range | 68.0% | 30.9% |
| Mean | 24.0% | 16.4% |
| Median | 20.5% | 17.0% |
| Interquartile 25% (IQ1) | 15.6% | 12.1% |
| Interquartile 75% (IQ3) | 28.9% | 19.4% |
| Interquartile Range (IQR) | 13.3% | 7.3% |
| Standard Deviation (Sample) | 12.5% | 5.7% |
| Standard Deviation (Population) | 12.4% | 5.7% |
Similar Demographics by 3 or more Vehicles in Household
Demographics Similar to Romanians by 3 or more Vehicles in Household
In terms of 3 or more vehicles in household, the demographic groups most similar to Romanians are South African (19.3%, a difference of 0.030%), Cuban (19.3%, a difference of 0.040%), Cajun (19.3%, a difference of 0.090%), Latvian (19.3%, a difference of 0.11%), and Immigrants from South Central Asia (19.3%, a difference of 0.15%).
| Demographics | Rating | Rank | 3 or more Vehicles in Household |
| Immigrants | South Africa | 50.0 /100 | #174 | Average 19.5% |
| Syrians | 47.0 /100 | #175 | Average 19.5% |
| Iroquois | 46.0 /100 | #176 | Average 19.4% |
| Immigrants | Peru | 41.1 /100 | #177 | Average 19.4% |
| Immigrants | Syria | 40.3 /100 | #178 | Average 19.4% |
| Immigrants | South Central Asia | 38.9 /100 | #179 | Fair 19.3% |
| South Africans | 37.5 /100 | #180 | Fair 19.3% |
| Romanians | 37.1 /100 | #181 | Fair 19.3% |
| Cubans | 36.6 /100 | #182 | Fair 19.3% |
| Cajuns | 36.0 /100 | #183 | Fair 19.3% |
| Latvians | 35.7 /100 | #184 | Fair 19.3% |
| Immigrants | Sri Lanka | 30.7 /100 | #185 | Fair 19.2% |
| Immigrants | Sweden | 29.0 /100 | #186 | Fair 19.2% |
| Immigrants | Hong Kong | 28.3 /100 | #187 | Fair 19.2% |
| Immigrants | Kuwait | 26.1 /100 | #188 | Fair 19.1% |
Demographics Similar to Immigrants from Liberia by 3 or more Vehicles in Household
In terms of 3 or more vehicles in household, the demographic groups most similar to Immigrants from Liberia are Immigrants from Uruguay (17.1%, a difference of 0.070%), Immigrants from Brazil (17.1%, a difference of 0.16%), Menominee (17.2%, a difference of 0.46%), Immigrants from Croatia (17.2%, a difference of 0.52%), and Liberian (17.0%, a difference of 0.57%).
| Demographics | Rating | Rank | 3 or more Vehicles in Household |
| Immigrants | Ireland | 0.3 /100 | #282 | Tragic 17.3% |
| Blacks/African Americans | 0.3 /100 | #283 | Tragic 17.3% |
| Immigrants | Colombia | 0.3 /100 | #284 | Tragic 17.3% |
| Immigrants | Croatia | 0.2 /100 | #285 | Tragic 17.2% |
| Menominee | 0.2 /100 | #286 | Tragic 17.2% |
| Immigrants | Brazil | 0.2 /100 | #287 | Tragic 17.1% |
| Immigrants | Uruguay | 0.2 /100 | #288 | Tragic 17.1% |
| Immigrants | Liberia | 0.1 /100 | #289 | Tragic 17.1% |
| Liberians | 0.1 /100 | #290 | Tragic 17.0% |
| Immigrants | Congo | 0.1 /100 | #291 | Tragic 17.0% |
| Immigrants | Spain | 0.1 /100 | #292 | Tragic 17.0% |
| Bahamians | 0.1 /100 | #293 | Tragic 16.9% |
| Immigrants | Western Africa | 0.1 /100 | #294 | Tragic 16.9% |
| Immigrants | Russia | 0.1 /100 | #295 | Tragic 16.9% |
| Inupiat | 0.1 /100 | #296 | Tragic 16.9% |