Portuguese vs Welsh 2 or more Vehicles in Household
COMPARE
Portuguese
Welsh
2 or more Vehicles in Household
2 or more Vehicles in Household Comparison
Portuguese
Welsh
58.6%
2 OR MORE VEHICLES IN HOUSEHOLD
99.7/ 100
METRIC RATING
64th/ 347
METRIC RANK
60.8%
2 OR MORE VEHICLES IN HOUSEHOLD
100.0/ 100
METRIC RATING
26th/ 347
METRIC RANK
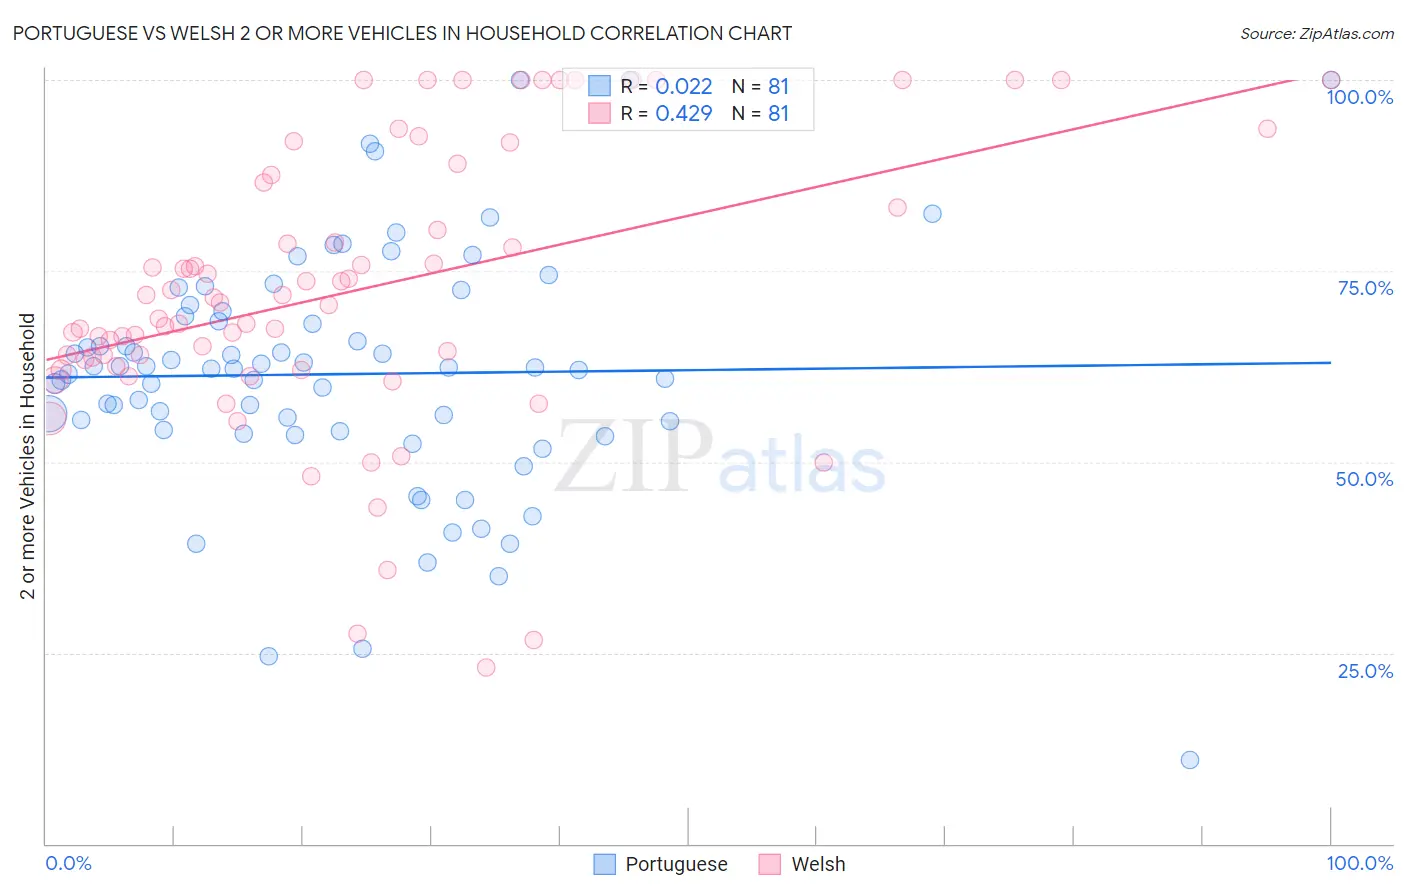
Portuguese vs Welsh 2 or more Vehicles in Household Correlation Chart
The statistical analysis conducted on geographies consisting of 450,032,677 people shows no correlation between the proportion of Portuguese and percentage of households with 2 or more vehicles available in the United States with a correlation coefficient (R) of 0.022 and weighted average of 58.6%. Similarly, the statistical analysis conducted on geographies consisting of 528,240,215 people shows a moderate positive correlation between the proportion of Welsh and percentage of households with 2 or more vehicles available in the United States with a correlation coefficient (R) of 0.429 and weighted average of 60.8%, a difference of 3.7%.
2 or more Vehicles in Household Correlation Summary
| Measurement | Portuguese | Welsh |
| Minimum | 11.0% | 23.1% |
| Maximum | 100.0% | 100.0% |
| Range | 89.0% | 76.9% |
| Mean | 61.5% | 72.5% |
| Median | 62.2% | 70.9% |
| Interquartile 25% (IQ1) | 54.1% | 62.9% |
| Interquartile 75% (IQ3) | 69.4% | 87.0% |
| Interquartile Range (IQR) | 15.3% | 24.1% |
| Standard Deviation (Sample) | 15.9% | 18.2% |
| Standard Deviation (Population) | 15.8% | 18.1% |
Similar Demographics by 2 or more Vehicles in Household
Demographics Similar to Portuguese by 2 or more Vehicles in Household
In terms of 2 or more vehicles in household, the demographic groups most similar to Portuguese are Immigrants from Central America (58.6%, a difference of 0.050%), Croatian (58.6%, a difference of 0.060%), Laotian (58.6%, a difference of 0.070%), Canadian (58.6%, a difference of 0.090%), and Mexican American Indian (58.7%, a difference of 0.16%).
| Demographics | Rating | Rank | 2 or more Vehicles in Household |
| Afghans | 99.9 /100 | #57 | Exceptional 59.0% |
| Immigrants | Scotland | 99.8 /100 | #58 | Exceptional 58.9% |
| Spanish Americans | 99.8 /100 | #59 | Exceptional 58.9% |
| French Canadians | 99.8 /100 | #60 | Exceptional 58.9% |
| Osage | 99.8 /100 | #61 | Exceptional 58.8% |
| Immigrants | Nonimmigrants | 99.8 /100 | #62 | Exceptional 58.8% |
| Mexican American Indians | 99.8 /100 | #63 | Exceptional 58.7% |
| Portuguese | 99.7 /100 | #64 | Exceptional 58.6% |
| Immigrants | Central America | 99.7 /100 | #65 | Exceptional 58.6% |
| Croatians | 99.7 /100 | #66 | Exceptional 58.6% |
| Laotians | 99.7 /100 | #67 | Exceptional 58.6% |
| Canadians | 99.7 /100 | #68 | Exceptional 58.6% |
| Pennsylvania Germans | 99.7 /100 | #69 | Exceptional 58.5% |
| Italians | 99.6 /100 | #70 | Exceptional 58.4% |
| Bangladeshis | 99.6 /100 | #71 | Exceptional 58.4% |
Demographics Similar to Welsh by 2 or more Vehicles in Household
In terms of 2 or more vehicles in household, the demographic groups most similar to Welsh are White/Caucasian (60.8%, a difference of 0.050%), Immigrants from Vietnam (60.9%, a difference of 0.20%), Scotch-Irish (60.9%, a difference of 0.24%), Swiss (61.0%, a difference of 0.28%), and Korean (61.0%, a difference of 0.31%).
| Demographics | Rating | Rank | 2 or more Vehicles in Household |
| Scottish | 100.0 /100 | #19 | Exceptional 61.2% |
| Sri Lankans | 100.0 /100 | #20 | Exceptional 61.0% |
| Koreans | 100.0 /100 | #21 | Exceptional 61.0% |
| Swiss | 100.0 /100 | #22 | Exceptional 61.0% |
| Scotch-Irish | 100.0 /100 | #23 | Exceptional 60.9% |
| Immigrants | Vietnam | 100.0 /100 | #24 | Exceptional 60.9% |
| Whites/Caucasians | 100.0 /100 | #25 | Exceptional 60.8% |
| Welsh | 100.0 /100 | #26 | Exceptional 60.8% |
| Assyrians/Chaldeans/Syriacs | 100.0 /100 | #27 | Exceptional 60.5% |
| Guamanians/Chamorros | 100.0 /100 | #28 | Exceptional 60.5% |
| Hawaiians | 100.0 /100 | #29 | Exceptional 60.4% |
| Finns | 100.0 /100 | #30 | Exceptional 60.3% |
| Spanish American Indians | 100.0 /100 | #31 | Exceptional 60.3% |
| Arapaho | 100.0 /100 | #32 | Exceptional 60.2% |
| Immigrants | Mexico | 100.0 /100 | #33 | Exceptional 60.2% |