Portuguese vs Trinidadian and Tobagonian Single Mother Households
COMPARE
Portuguese
Trinidadian and Tobagonian
Single Mother Households
Single Mother Households Comparison
Portuguese
Trinidadians and Tobagonians
6.4%
SINGLE MOTHER HOUSEHOLDS
40.0/ 100
METRIC RATING
178th/ 347
METRIC RANK
7.7%
SINGLE MOTHER HOUSEHOLDS
0.0/ 100
METRIC RATING
285th/ 347
METRIC RANK
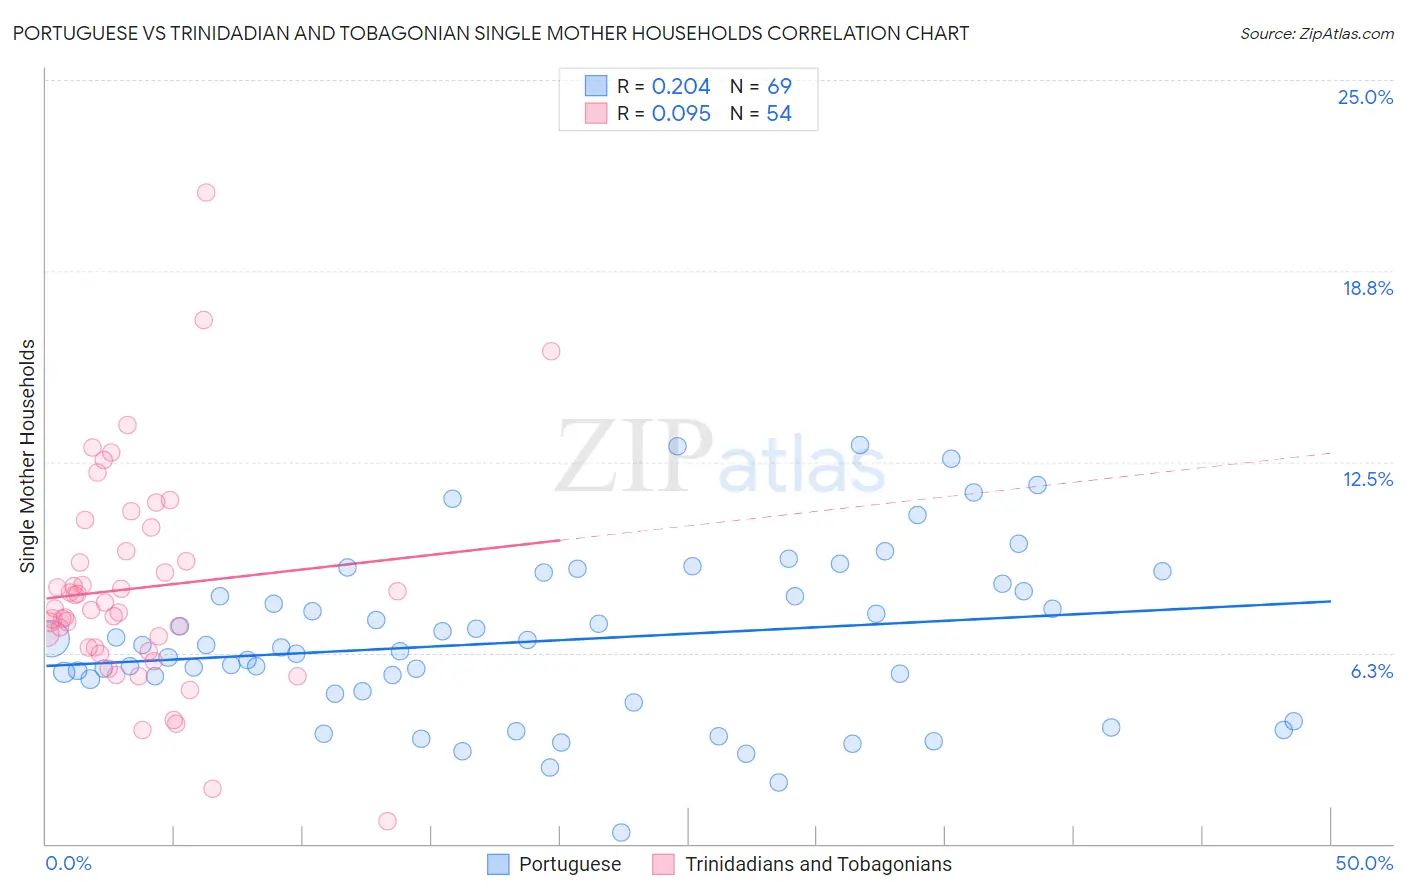
Portuguese vs Trinidadian and Tobagonian Single Mother Households Correlation Chart
The statistical analysis conducted on geographies consisting of 448,231,637 people shows a weak positive correlation between the proportion of Portuguese and percentage of single mother households in the United States with a correlation coefficient (R) of 0.204 and weighted average of 6.4%. Similarly, the statistical analysis conducted on geographies consisting of 219,557,612 people shows a slight positive correlation between the proportion of Trinidadians and Tobagonians and percentage of single mother households in the United States with a correlation coefficient (R) of 0.095 and weighted average of 7.7%, a difference of 20.9%.
Single Mother Households Correlation Summary
| Measurement | Portuguese | Trinidadian and Tobagonian |
| Minimum | 0.35% | 0.73% |
| Maximum | 13.1% | 21.3% |
| Range | 12.7% | 20.6% |
| Mean | 6.7% | 8.4% |
| Median | 6.4% | 7.7% |
| Interquartile 25% (IQ1) | 5.0% | 6.4% |
| Interquartile 75% (IQ3) | 8.4% | 9.6% |
| Interquartile Range (IQR) | 3.4% | 3.2% |
| Standard Deviation (Sample) | 2.7% | 3.6% |
| Standard Deviation (Population) | 2.7% | 3.6% |
Similar Demographics by Single Mother Households
Demographics Similar to Portuguese by Single Mother Households
In terms of single mother households, the demographic groups most similar to Portuguese are Hmong (6.4%, a difference of 0.020%), Osage (6.4%, a difference of 0.34%), Immigrants from Nepal (6.4%, a difference of 0.45%), Immigrants from Bosnia and Herzegovina (6.3%, a difference of 0.49%), and Marshallese (6.3%, a difference of 0.65%).
| Demographics | Rating | Rank | Single Mother Households |
| Afghans | 52.5 /100 | #171 | Average 6.3% |
| Immigrants | South Eastern Asia | 52.2 /100 | #172 | Average 6.3% |
| Immigrants | Vietnam | 51.5 /100 | #173 | Average 6.3% |
| Immigrants | Morocco | 50.0 /100 | #174 | Average 6.3% |
| Marshallese | 45.8 /100 | #175 | Average 6.3% |
| Immigrants | Bosnia and Herzegovina | 44.3 /100 | #176 | Average 6.3% |
| Osage | 43.0 /100 | #177 | Average 6.4% |
| Portuguese | 40.0 /100 | #178 | Fair 6.4% |
| Hmong | 39.8 /100 | #179 | Fair 6.4% |
| Immigrants | Nepal | 36.1 /100 | #180 | Fair 6.4% |
| Spanish | 33.4 /100 | #181 | Fair 6.4% |
| South American Indians | 33.4 /100 | #182 | Fair 6.4% |
| Spaniards | 27.8 /100 | #183 | Fair 6.5% |
| Ethiopians | 26.0 /100 | #184 | Fair 6.5% |
| Ugandans | 25.6 /100 | #185 | Fair 6.5% |
Demographics Similar to Trinidadians and Tobagonians by Single Mother Households
In terms of single mother households, the demographic groups most similar to Trinidadians and Tobagonians are Immigrants from Belize (7.7%, a difference of 0.030%), Immigrants from Middle Africa (7.7%, a difference of 0.11%), Immigrants from Guatemala (7.7%, a difference of 0.21%), Sierra Leonean (7.7%, a difference of 0.26%), and Nigerian (7.7%, a difference of 0.63%).
| Demographics | Rating | Rank | Single Mother Households |
| Central Americans | 0.1 /100 | #278 | Tragic 7.6% |
| Immigrants | El Salvador | 0.0 /100 | #279 | Tragic 7.6% |
| Immigrants | Sierra Leone | 0.0 /100 | #280 | Tragic 7.7% |
| Immigrants | Laos | 0.0 /100 | #281 | Tragic 7.7% |
| Guatemalans | 0.0 /100 | #282 | Tragic 7.7% |
| Nigerians | 0.0 /100 | #283 | Tragic 7.7% |
| Immigrants | Belize | 0.0 /100 | #284 | Tragic 7.7% |
| Trinidadians and Tobagonians | 0.0 /100 | #285 | Tragic 7.7% |
| Immigrants | Middle Africa | 0.0 /100 | #286 | Tragic 7.7% |
| Immigrants | Guatemala | 0.0 /100 | #287 | Tragic 7.7% |
| Sierra Leoneans | 0.0 /100 | #288 | Tragic 7.7% |
| Sub-Saharan Africans | 0.0 /100 | #289 | Tragic 7.8% |
| Immigrants | Nigeria | 0.0 /100 | #290 | Tragic 7.8% |
| West Indians | 0.0 /100 | #291 | Tragic 7.8% |
| Ghanaians | 0.0 /100 | #292 | Tragic 7.8% |