Peruvian vs Immigrants from Latvia Unemployment Among Youth under 25 years
COMPARE
Peruvian
Immigrants from Latvia
Unemployment Among Youth under 25 years
Unemployment Among Youth under 25 years Comparison
Peruvians
Immigrants from Latvia
11.8%
UNEMPLOYMENT AMONG YOUTH UNDER 25 YEARS
14.0/ 100
METRIC RATING
205th/ 347
METRIC RANK
11.2%
UNEMPLOYMENT AMONG YOUTH UNDER 25 YEARS
95.1/ 100
METRIC RATING
92nd/ 347
METRIC RANK
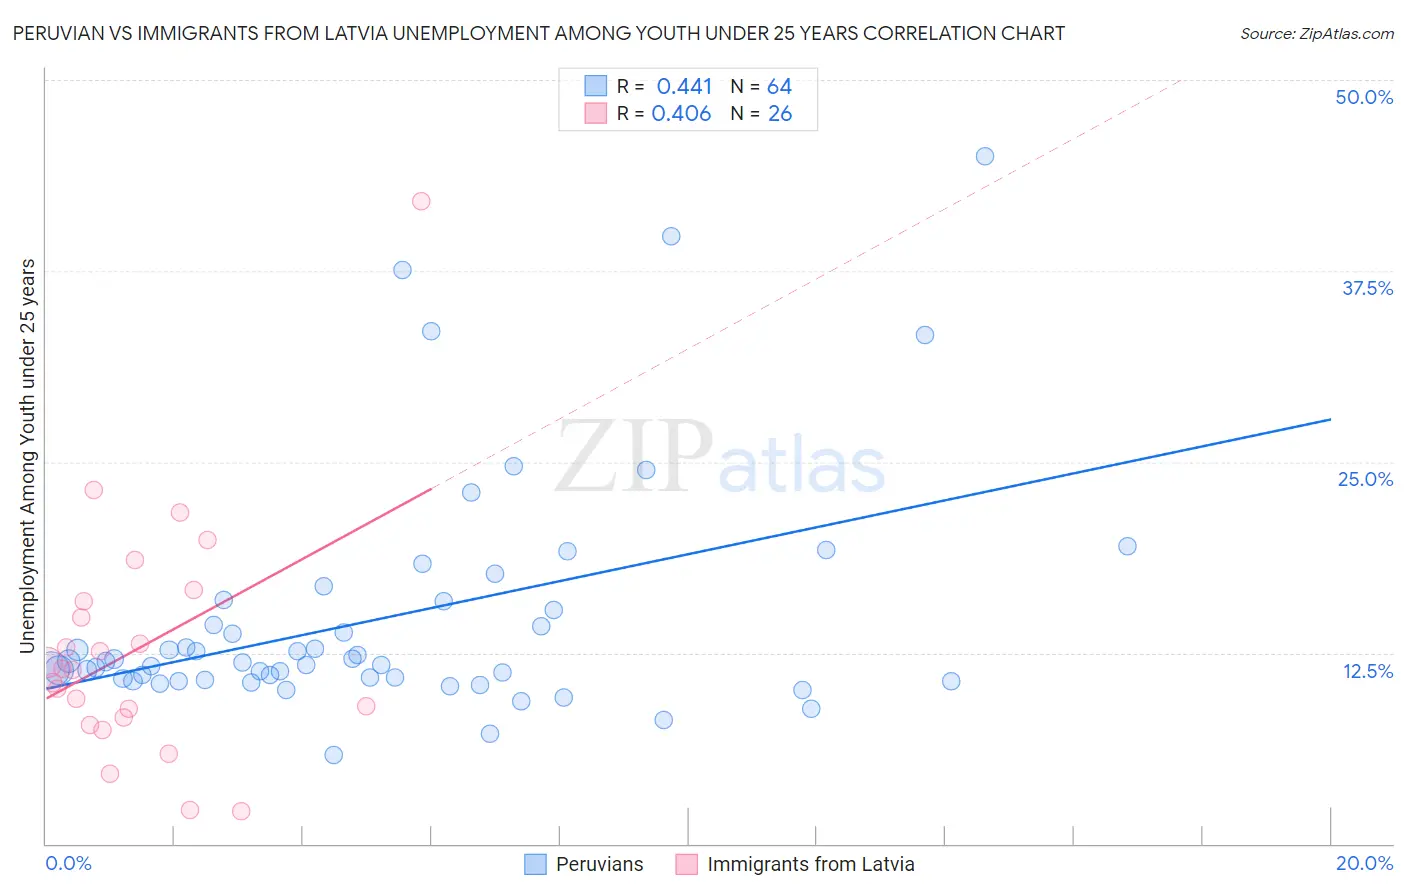
Peruvian vs Immigrants from Latvia Unemployment Among Youth under 25 years Correlation Chart
The statistical analysis conducted on geographies consisting of 360,264,101 people shows a moderate positive correlation between the proportion of Peruvians and unemployment rate among youth under the age of 25 in the United States with a correlation coefficient (R) of 0.441 and weighted average of 11.8%. Similarly, the statistical analysis conducted on geographies consisting of 113,252,048 people shows a moderate positive correlation between the proportion of Immigrants from Latvia and unemployment rate among youth under the age of 25 in the United States with a correlation coefficient (R) of 0.406 and weighted average of 11.2%, a difference of 5.1%.
Unemployment Among Youth under 25 years Correlation Summary
| Measurement | Peruvian | Immigrants from Latvia |
| Minimum | 5.8% | 2.1% |
| Maximum | 45.0% | 42.1% |
| Range | 39.2% | 40.0% |
| Mean | 14.8% | 12.8% |
| Median | 11.9% | 11.4% |
| Interquartile 25% (IQ1) | 10.8% | 8.3% |
| Interquartile 75% (IQ3) | 15.6% | 15.8% |
| Interquartile Range (IQR) | 4.8% | 7.5% |
| Standard Deviation (Sample) | 7.8% | 8.1% |
| Standard Deviation (Population) | 7.7% | 7.9% |
Similar Demographics by Unemployment Among Youth under 25 years
Demographics Similar to Peruvians by Unemployment Among Youth under 25 years
In terms of unemployment among youth under 25 years, the demographic groups most similar to Peruvians are Immigrants from Peru (11.8%, a difference of 0.10%), Immigrants from Costa Rica (11.8%, a difference of 0.10%), Immigrants from Pakistan (11.8%, a difference of 0.13%), Marshallese (11.8%, a difference of 0.14%), and Immigrants from Southern Europe (11.8%, a difference of 0.15%).
| Demographics | Rating | Rank | Unemployment Among Youth under 25 years |
| Cherokee | 21.2 /100 | #198 | Fair 11.8% |
| Immigrants | Colombia | 20.9 /100 | #199 | Fair 11.8% |
| Arabs | 18.0 /100 | #200 | Poor 11.8% |
| Palestinians | 16.0 /100 | #201 | Poor 11.8% |
| Marshallese | 15.8 /100 | #202 | Poor 11.8% |
| Immigrants | Peru | 15.3 /100 | #203 | Poor 11.8% |
| Immigrants | Costa Rica | 15.2 /100 | #204 | Poor 11.8% |
| Peruvians | 14.0 /100 | #205 | Poor 11.8% |
| Immigrants | Pakistan | 12.6 /100 | #206 | Poor 11.8% |
| Immigrants | Southern Europe | 12.3 /100 | #207 | Poor 11.8% |
| Comanche | 12.1 /100 | #208 | Poor 11.8% |
| Immigrants | Lebanon | 11.3 /100 | #209 | Poor 11.8% |
| Assyrians/Chaldeans/Syriacs | 9.8 /100 | #210 | Tragic 11.9% |
| Immigrants | Philippines | 9.2 /100 | #211 | Tragic 11.9% |
| Colombians | 9.1 /100 | #212 | Tragic 11.9% |
Demographics Similar to Immigrants from Latvia by Unemployment Among Youth under 25 years
In terms of unemployment among youth under 25 years, the demographic groups most similar to Immigrants from Latvia are Immigrants from Taiwan (11.2%, a difference of 0.0%), Immigrants from North America (11.2%, a difference of 0.0%), Lithuanian (11.3%, a difference of 0.070%), Immigrants from Bolivia (11.2%, a difference of 0.080%), and Immigrants from Japan (11.2%, a difference of 0.090%).
| Demographics | Rating | Rank | Unemployment Among Youth under 25 years |
| Immigrants | South Central Asia | 95.9 /100 | #85 | Exceptional 11.2% |
| Immigrants | South Africa | 95.8 /100 | #86 | Exceptional 11.2% |
| Kenyans | 95.7 /100 | #87 | Exceptional 11.2% |
| Austrians | 95.5 /100 | #88 | Exceptional 11.2% |
| Immigrants | Japan | 95.5 /100 | #89 | Exceptional 11.2% |
| Immigrants | Bolivia | 95.5 /100 | #90 | Exceptional 11.2% |
| Immigrants | Taiwan | 95.1 /100 | #91 | Exceptional 11.2% |
| Immigrants | Latvia | 95.1 /100 | #92 | Exceptional 11.2% |
| Immigrants | North America | 95.1 /100 | #93 | Exceptional 11.2% |
| Lithuanians | 94.8 /100 | #94 | Exceptional 11.3% |
| Carpatho Rusyns | 94.4 /100 | #95 | Exceptional 11.3% |
| Immigrants | Serbia | 94.4 /100 | #96 | Exceptional 11.3% |
| Nicaraguans | 94.3 /100 | #97 | Exceptional 11.3% |
| Estonians | 94.2 /100 | #98 | Exceptional 11.3% |
| Celtics | 94.0 /100 | #99 | Exceptional 11.3% |