Peruvian vs Immigrants from Latvia Male Unemployment
COMPARE
Peruvian
Immigrants from Latvia
Male Unemployment
Male Unemployment Comparison
Peruvians
Immigrants from Latvia
5.3%
MALE UNEMPLOYMENT
51.9/ 100
METRIC RATING
171st/ 347
METRIC RANK
5.1%
MALE UNEMPLOYMENT
87.5/ 100
METRIC RATING
124th/ 347
METRIC RANK
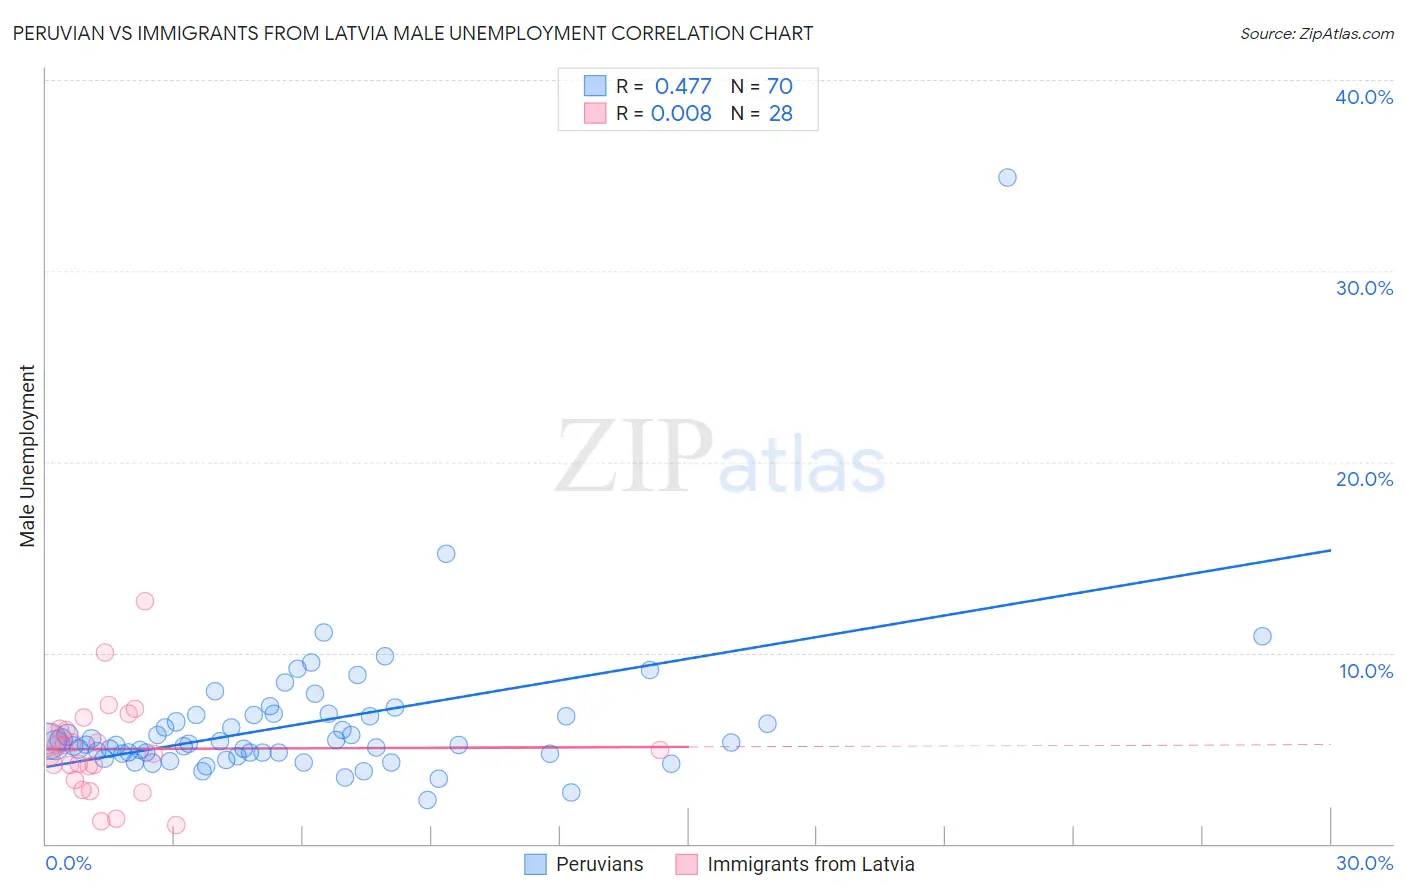
Peruvian vs Immigrants from Latvia Male Unemployment Correlation Chart
The statistical analysis conducted on geographies consisting of 362,248,150 people shows a moderate positive correlation between the proportion of Peruvians and unemployment rate among males in the United States with a correlation coefficient (R) of 0.477 and weighted average of 5.3%. Similarly, the statistical analysis conducted on geographies consisting of 113,659,649 people shows no correlation between the proportion of Immigrants from Latvia and unemployment rate among males in the United States with a correlation coefficient (R) of 0.008 and weighted average of 5.1%, a difference of 2.8%.
Male Unemployment Correlation Summary
| Measurement | Peruvian | Immigrants from Latvia |
| Minimum | 2.3% | 1.0% |
| Maximum | 34.9% | 12.7% |
| Range | 32.6% | 11.7% |
| Mean | 6.3% | 5.0% |
| Median | 5.2% | 4.8% |
| Interquartile 25% (IQ1) | 4.7% | 3.7% |
| Interquartile 75% (IQ3) | 6.7% | 6.0% |
| Interquartile Range (IQR) | 2.0% | 2.3% |
| Standard Deviation (Sample) | 4.1% | 2.5% |
| Standard Deviation (Population) | 4.0% | 2.5% |
Similar Demographics by Male Unemployment
Demographics Similar to Peruvians by Male Unemployment
In terms of male unemployment, the demographic groups most similar to Peruvians are Immigrants from Kazakhstan (5.3%, a difference of 0.060%), Immigrants from Russia (5.3%, a difference of 0.070%), Immigrants from Iran (5.3%, a difference of 0.11%), Immigrants from Eastern Europe (5.3%, a difference of 0.13%), and Immigrants from Iraq (5.3%, a difference of 0.22%).
| Demographics | Rating | Rank | Male Unemployment |
| Afghans | 62.0 /100 | #164 | Good 5.3% |
| South Americans | 60.6 /100 | #165 | Good 5.3% |
| Immigrants | Morocco | 60.2 /100 | #166 | Good 5.3% |
| Immigrants | Vietnam | 58.1 /100 | #167 | Average 5.3% |
| Immigrants | Ireland | 57.7 /100 | #168 | Average 5.3% |
| Immigrants | Congo | 57.4 /100 | #169 | Average 5.3% |
| Immigrants | Eastern Europe | 54.1 /100 | #170 | Average 5.3% |
| Peruvians | 51.9 /100 | #171 | Average 5.3% |
| Immigrants | Kazakhstan | 50.8 /100 | #172 | Average 5.3% |
| Immigrants | Russia | 50.7 /100 | #173 | Average 5.3% |
| Immigrants | Iran | 50.0 /100 | #174 | Average 5.3% |
| Immigrants | Iraq | 48.1 /100 | #175 | Average 5.3% |
| Immigrants | Poland | 46.0 /100 | #176 | Average 5.3% |
| Immigrants | Peru | 44.6 /100 | #177 | Average 5.3% |
| Osage | 42.5 /100 | #178 | Average 5.3% |
Demographics Similar to Immigrants from Latvia by Male Unemployment
In terms of male unemployment, the demographic groups most similar to Immigrants from Latvia are Palestinian (5.1%, a difference of 0.030%), Immigrants from Lithuania (5.1%, a difference of 0.040%), Nicaraguan (5.1%, a difference of 0.10%), Immigrants from Colombia (5.1%, a difference of 0.10%), and Ukrainian (5.1%, a difference of 0.13%).
| Demographics | Rating | Rank | Male Unemployment |
| Estonians | 89.0 /100 | #117 | Excellent 5.1% |
| Cypriots | 88.8 /100 | #118 | Excellent 5.1% |
| French Canadians | 88.6 /100 | #119 | Excellent 5.1% |
| Ukrainians | 88.4 /100 | #120 | Excellent 5.1% |
| Mongolians | 88.4 /100 | #121 | Excellent 5.1% |
| Nicaraguans | 88.2 /100 | #122 | Excellent 5.1% |
| Palestinians | 87.7 /100 | #123 | Excellent 5.1% |
| Immigrants | Latvia | 87.5 /100 | #124 | Excellent 5.1% |
| Immigrants | Lithuania | 87.2 /100 | #125 | Excellent 5.1% |
| Immigrants | Colombia | 86.8 /100 | #126 | Excellent 5.1% |
| Immigrants | Brazil | 86.3 /100 | #127 | Excellent 5.2% |
| Hungarians | 85.1 /100 | #128 | Excellent 5.2% |
| Immigrants | Western Europe | 84.8 /100 | #129 | Excellent 5.2% |
| Immigrants | Malaysia | 83.5 /100 | #130 | Excellent 5.2% |
| Immigrants | Germany | 83.0 /100 | #131 | Excellent 5.2% |