Paiute vs Jamaican No Vehicles in Household
COMPARE
Paiute
Jamaican
No Vehicles in Household
No Vehicles in Household Comparison
Paiute
Jamaicans
11.8%
NO VEHICLES IN HOUSEHOLD
1.8/ 100
METRIC RATING
250th/ 347
METRIC RANK
17.9%
NO VEHICLES IN HOUSEHOLD
0.0/ 100
METRIC RATING
321st/ 347
METRIC RANK
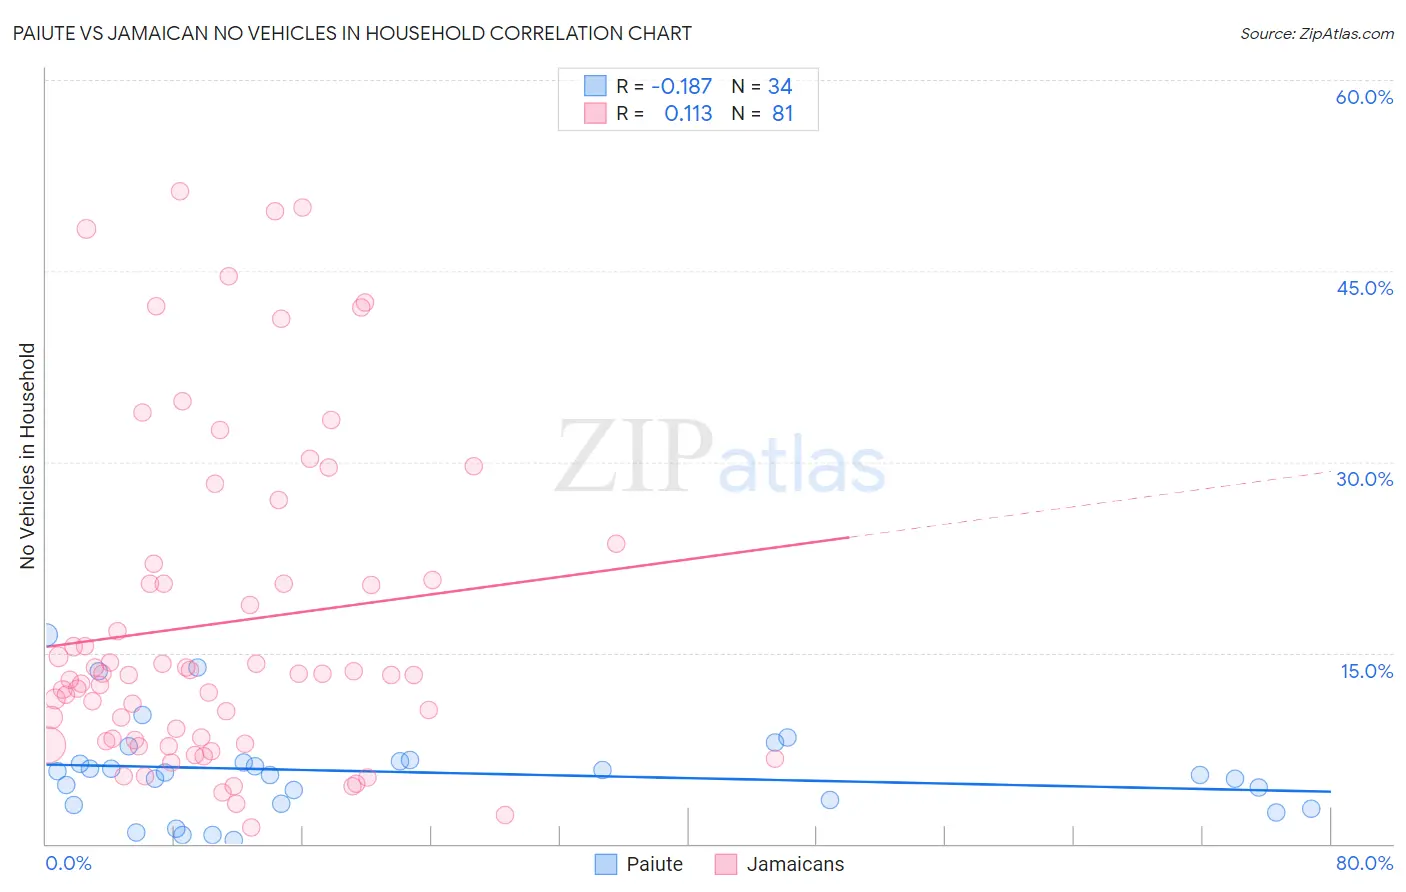
Paiute vs Jamaican No Vehicles in Household Correlation Chart
The statistical analysis conducted on geographies consisting of 58,352,157 people shows a poor negative correlation between the proportion of Paiute and percentage of households with no vehicle available in the United States with a correlation coefficient (R) of -0.187 and weighted average of 11.8%. Similarly, the statistical analysis conducted on geographies consisting of 367,140,224 people shows a poor positive correlation between the proportion of Jamaicans and percentage of households with no vehicle available in the United States with a correlation coefficient (R) of 0.113 and weighted average of 17.9%, a difference of 51.8%.
No Vehicles in Household Correlation Summary
| Measurement | Paiute | Jamaican |
| Minimum | 0.32% | 1.2% |
| Maximum | 16.4% | 51.3% |
| Range | 16.0% | 50.0% |
| Mean | 5.6% | 17.3% |
| Median | 5.5% | 13.3% |
| Interquartile 25% (IQ1) | 3.1% | 8.1% |
| Interquartile 75% (IQ3) | 6.5% | 21.3% |
| Interquartile Range (IQR) | 3.4% | 13.2% |
| Standard Deviation (Sample) | 3.7% | 12.8% |
| Standard Deviation (Population) | 3.6% | 12.7% |
Similar Demographics by No Vehicles in Household
Demographics Similar to Paiute by No Vehicles in Household
In terms of no vehicles in household, the demographic groups most similar to Paiute are Immigrants from Nigeria (11.8%, a difference of 0.22%), Immigrants from Czechoslovakia (11.8%, a difference of 0.26%), Immigrants from Belgium (11.8%, a difference of 0.26%), Menominee (11.8%, a difference of 0.32%), and Black/African American (11.9%, a difference of 0.35%).
| Demographics | Rating | Rank | No Vehicles in Household |
| Cheyenne | 2.4 /100 | #243 | Tragic 11.7% |
| Immigrants | Portugal | 2.2 /100 | #244 | Tragic 11.7% |
| Immigrants | Honduras | 2.1 /100 | #245 | Tragic 11.8% |
| Menominee | 2.0 /100 | #246 | Tragic 11.8% |
| Immigrants | Czechoslovakia | 2.0 /100 | #247 | Tragic 11.8% |
| Immigrants | Belgium | 1.9 /100 | #248 | Tragic 11.8% |
| Immigrants | Nigeria | 1.9 /100 | #249 | Tragic 11.8% |
| Paiute | 1.8 /100 | #250 | Tragic 11.8% |
| Blacks/African Americans | 1.6 /100 | #251 | Tragic 11.9% |
| Immigrants | Serbia | 1.5 /100 | #252 | Tragic 11.9% |
| Egyptians | 1.4 /100 | #253 | Tragic 11.9% |
| Immigrants | Uruguay | 1.3 /100 | #254 | Tragic 11.9% |
| Hondurans | 1.2 /100 | #255 | Tragic 12.0% |
| Liberians | 1.2 /100 | #256 | Tragic 12.0% |
| Nigerians | 0.9 /100 | #257 | Tragic 12.1% |
Demographics Similar to Jamaicans by No Vehicles in Household
In terms of no vehicles in household, the demographic groups most similar to Jamaicans are Immigrants from Cabo Verde (18.4%, a difference of 2.9%), Soviet Union (17.4%, a difference of 2.9%), Alaska Native (17.4%, a difference of 3.0%), Immigrants from Belarus (16.7%, a difference of 7.1%), and Immigrants from Ghana (16.6%, a difference of 8.0%).
| Demographics | Rating | Rank | No Vehicles in Household |
| Albanians | 0.0 /100 | #314 | Tragic 15.6% |
| Cypriots | 0.0 /100 | #315 | Tragic 15.7% |
| Ghanaians | 0.0 /100 | #316 | Tragic 16.4% |
| Immigrants | Ghana | 0.0 /100 | #317 | Tragic 16.6% |
| Immigrants | Belarus | 0.0 /100 | #318 | Tragic 16.7% |
| Alaska Natives | 0.0 /100 | #319 | Tragic 17.4% |
| Soviet Union | 0.0 /100 | #320 | Tragic 17.4% |
| Jamaicans | 0.0 /100 | #321 | Tragic 17.9% |
| Immigrants | Cabo Verde | 0.0 /100 | #322 | Tragic 18.4% |
| Immigrants | Yemen | 0.0 /100 | #323 | Tragic 19.5% |
| Immigrants | Caribbean | 0.0 /100 | #324 | Tragic 19.6% |
| Senegalese | 0.0 /100 | #325 | Tragic 19.8% |
| Immigrants | West Indies | 0.0 /100 | #326 | Tragic 20.5% |
| Immigrants | Senegal | 0.0 /100 | #327 | Tragic 21.1% |
| Immigrants | Dominica | 0.0 /100 | #328 | Tragic 22.2% |