Paiute vs New Zealander No Schooling Completed
COMPARE
Paiute
New Zealander
No Schooling Completed
No Schooling Completed Comparison
Paiute
New Zealanders
2.4%
NO SCHOOLING COMPLETED
1.9/ 100
METRIC RATING
238th/ 347
METRIC RANK
1.7%
NO SCHOOLING COMPLETED
99.7/ 100
METRIC RATING
64th/ 347
METRIC RANK
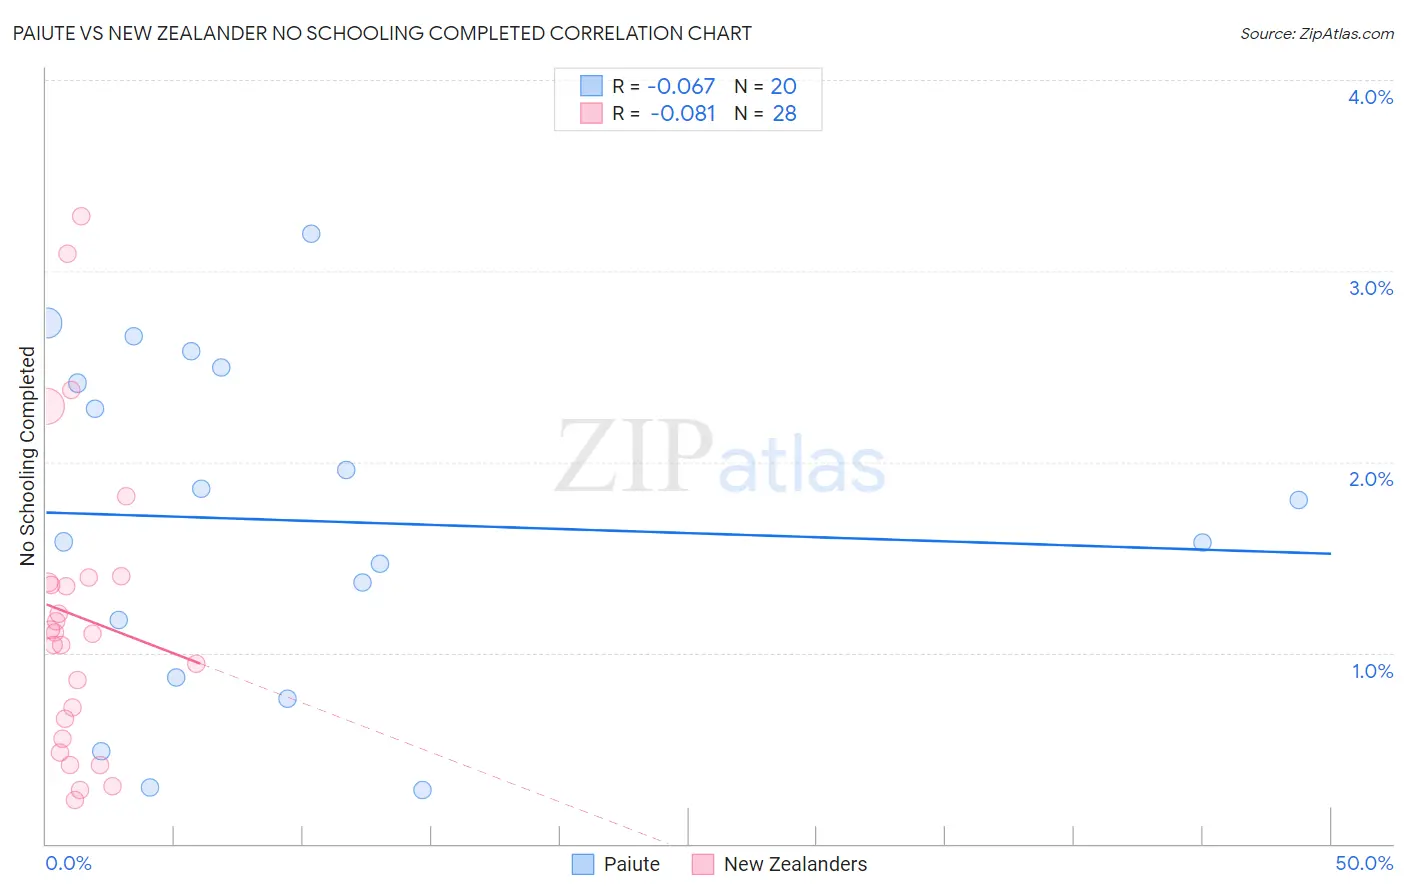
Paiute vs New Zealander No Schooling Completed Correlation Chart
The statistical analysis conducted on geographies consisting of 58,130,923 people shows a slight negative correlation between the proportion of Paiute and percentage of population with no schooling in the United States with a correlation coefficient (R) of -0.067 and weighted average of 2.4%. Similarly, the statistical analysis conducted on geographies consisting of 106,449,248 people shows a slight negative correlation between the proportion of New Zealanders and percentage of population with no schooling in the United States with a correlation coefficient (R) of -0.081 and weighted average of 1.7%, a difference of 41.7%.
No Schooling Completed Correlation Summary
| Measurement | Paiute | New Zealander |
| Minimum | 0.28% | 0.23% |
| Maximum | 3.2% | 3.3% |
| Range | 2.9% | 3.1% |
| Mean | 1.7% | 1.2% |
| Median | 1.7% | 1.1% |
| Interquartile 25% (IQ1) | 1.0% | 0.60% |
| Interquartile 75% (IQ3) | 2.5% | 1.4% |
| Interquartile Range (IQR) | 1.4% | 0.78% |
| Standard Deviation (Sample) | 0.86% | 0.78% |
| Standard Deviation (Population) | 0.84% | 0.77% |
Similar Demographics by No Schooling Completed
Demographics Similar to Paiute by No Schooling Completed
In terms of no schooling completed, the demographic groups most similar to Paiute are Liberian (2.4%, a difference of 0.12%), Immigrants from Eastern Asia (2.4%, a difference of 0.21%), Immigrants from Senegal (2.4%, a difference of 0.35%), Iraqi (2.4%, a difference of 0.41%), and Korean (2.4%, a difference of 0.41%).
| Demographics | Rating | Rank | No Schooling Completed |
| Immigrants | Uruguay | 3.4 /100 | #231 | Tragic 2.3% |
| Colombians | 3.2 /100 | #232 | Tragic 2.3% |
| Immigrants | Malaysia | 2.8 /100 | #233 | Tragic 2.3% |
| Nigerians | 2.6 /100 | #234 | Tragic 2.3% |
| Immigrants | Western Asia | 2.6 /100 | #235 | Tragic 2.3% |
| Iraqis | 2.2 /100 | #236 | Tragic 2.4% |
| Immigrants | Eastern Asia | 2.0 /100 | #237 | Tragic 2.4% |
| Paiute | 1.9 /100 | #238 | Tragic 2.4% |
| Liberians | 1.8 /100 | #239 | Tragic 2.4% |
| Immigrants | Senegal | 1.7 /100 | #240 | Tragic 2.4% |
| Koreans | 1.7 /100 | #241 | Tragic 2.4% |
| Immigrants | Indonesia | 1.5 /100 | #242 | Tragic 2.4% |
| South Americans | 1.5 /100 | #243 | Tragic 2.4% |
| Peruvians | 1.4 /100 | #244 | Tragic 2.4% |
| Bolivians | 1.4 /100 | #245 | Tragic 2.4% |
Demographics Similar to New Zealanders by No Schooling Completed
In terms of no schooling completed, the demographic groups most similar to New Zealanders are Serbian (1.7%, a difference of 0.040%), Russian (1.7%, a difference of 0.16%), Canadian (1.7%, a difference of 0.18%), Immigrants from Northern Europe (1.7%, a difference of 0.20%), and Immigrants from Austria (1.7%, a difference of 0.37%).
| Demographics | Rating | Rank | No Schooling Completed |
| Austrians | 99.8 /100 | #57 | Exceptional 1.6% |
| Kiowa | 99.8 /100 | #58 | Exceptional 1.6% |
| Slavs | 99.8 /100 | #59 | Exceptional 1.7% |
| Americans | 99.8 /100 | #60 | Exceptional 1.7% |
| Tsimshian | 99.8 /100 | #61 | Exceptional 1.7% |
| Immigrants | Northern Europe | 99.8 /100 | #62 | Exceptional 1.7% |
| Russians | 99.8 /100 | #63 | Exceptional 1.7% |
| New Zealanders | 99.7 /100 | #64 | Exceptional 1.7% |
| Serbians | 99.7 /100 | #65 | Exceptional 1.7% |
| Canadians | 99.7 /100 | #66 | Exceptional 1.7% |
| Immigrants | Austria | 99.7 /100 | #67 | Exceptional 1.7% |
| Immigrants | Lithuania | 99.7 /100 | #68 | Exceptional 1.7% |
| Chickasaw | 99.6 /100 | #69 | Exceptional 1.7% |
| Immigrants | Netherlands | 99.6 /100 | #70 | Exceptional 1.7% |
| Immigrants | England | 99.5 /100 | #71 | Exceptional 1.7% |