Paiute vs Immigrants from Greece No Vehicles in Household
COMPARE
Paiute
Immigrants from Greece
No Vehicles in Household
No Vehicles in Household Comparison
Paiute
Immigrants from Greece
11.8%
NO VEHICLES IN HOUSEHOLD
1.8/ 100
METRIC RATING
250th/ 347
METRIC RANK
14.7%
NO VEHICLES IN HOUSEHOLD
0.0/ 100
METRIC RATING
299th/ 347
METRIC RANK
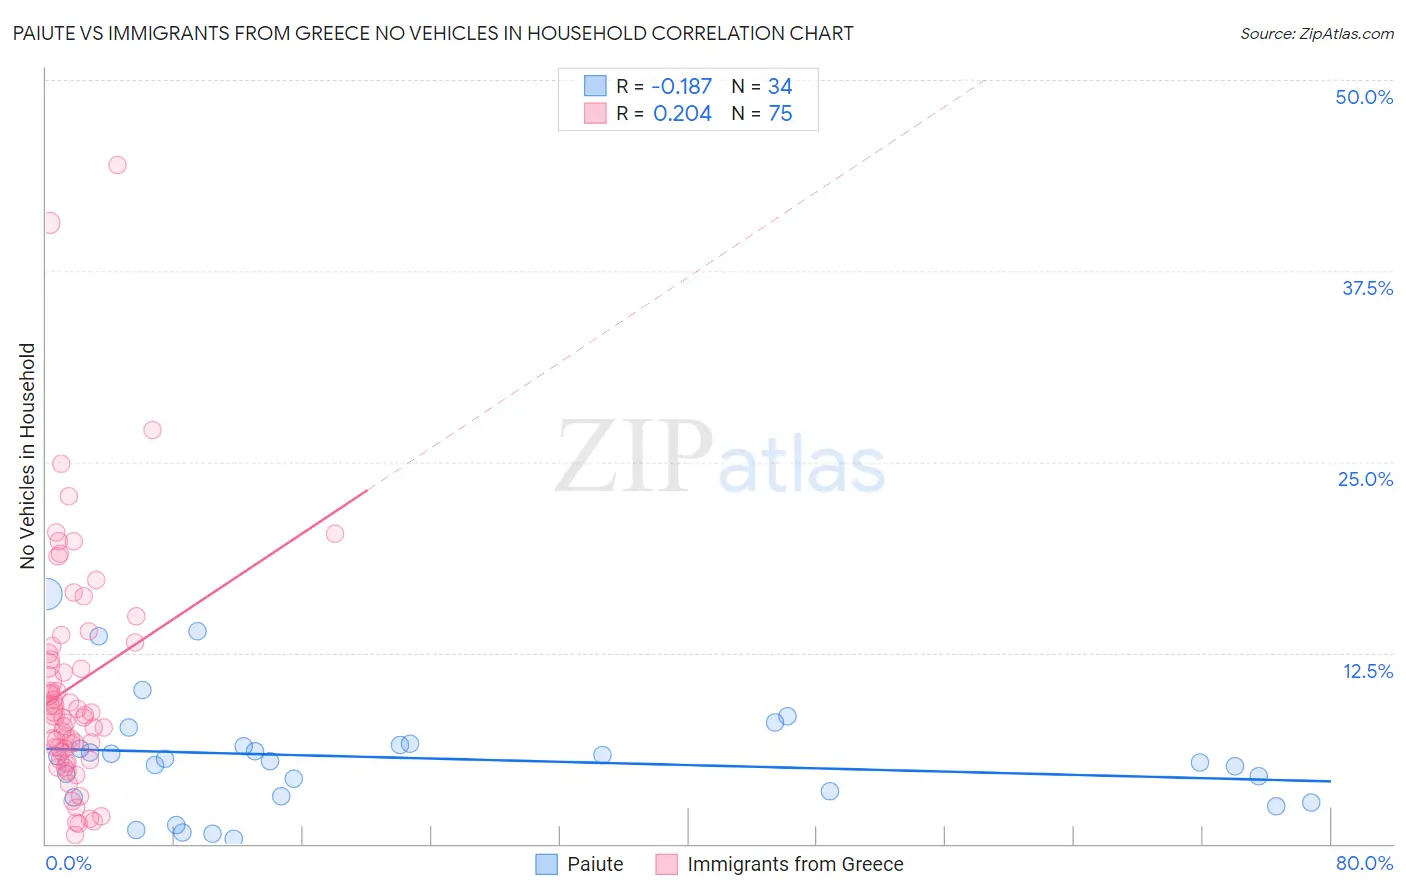
Paiute vs Immigrants from Greece No Vehicles in Household Correlation Chart
The statistical analysis conducted on geographies consisting of 58,352,157 people shows a poor negative correlation between the proportion of Paiute and percentage of households with no vehicle available in the United States with a correlation coefficient (R) of -0.187 and weighted average of 11.8%. Similarly, the statistical analysis conducted on geographies consisting of 216,580,557 people shows a weak positive correlation between the proportion of Immigrants from Greece and percentage of households with no vehicle available in the United States with a correlation coefficient (R) of 0.204 and weighted average of 14.7%, a difference of 24.4%.
No Vehicles in Household Correlation Summary
| Measurement | Paiute | Immigrants from Greece |
| Minimum | 0.32% | 0.60% |
| Maximum | 16.4% | 44.5% |
| Range | 16.0% | 43.9% |
| Mean | 5.6% | 10.4% |
| Median | 5.5% | 8.4% |
| Interquartile 25% (IQ1) | 3.1% | 6.1% |
| Interquartile 75% (IQ3) | 6.5% | 13.0% |
| Interquartile Range (IQR) | 3.4% | 6.9% |
| Standard Deviation (Sample) | 3.7% | 7.9% |
| Standard Deviation (Population) | 3.6% | 7.8% |
Similar Demographics by No Vehicles in Household
Demographics Similar to Paiute by No Vehicles in Household
In terms of no vehicles in household, the demographic groups most similar to Paiute are Immigrants from Nigeria (11.8%, a difference of 0.22%), Immigrants from Czechoslovakia (11.8%, a difference of 0.26%), Immigrants from Belgium (11.8%, a difference of 0.26%), Menominee (11.8%, a difference of 0.32%), and Black/African American (11.9%, a difference of 0.35%).
| Demographics | Rating | Rank | No Vehicles in Household |
| Cheyenne | 2.4 /100 | #243 | Tragic 11.7% |
| Immigrants | Portugal | 2.2 /100 | #244 | Tragic 11.7% |
| Immigrants | Honduras | 2.1 /100 | #245 | Tragic 11.8% |
| Menominee | 2.0 /100 | #246 | Tragic 11.8% |
| Immigrants | Czechoslovakia | 2.0 /100 | #247 | Tragic 11.8% |
| Immigrants | Belgium | 1.9 /100 | #248 | Tragic 11.8% |
| Immigrants | Nigeria | 1.9 /100 | #249 | Tragic 11.8% |
| Paiute | 1.8 /100 | #250 | Tragic 11.8% |
| Blacks/African Americans | 1.6 /100 | #251 | Tragic 11.9% |
| Immigrants | Serbia | 1.5 /100 | #252 | Tragic 11.9% |
| Egyptians | 1.4 /100 | #253 | Tragic 11.9% |
| Immigrants | Uruguay | 1.3 /100 | #254 | Tragic 11.9% |
| Hondurans | 1.2 /100 | #255 | Tragic 12.0% |
| Liberians | 1.2 /100 | #256 | Tragic 12.0% |
| Nigerians | 0.9 /100 | #257 | Tragic 12.1% |
Demographics Similar to Immigrants from Greece by No Vehicles in Household
In terms of no vehicles in household, the demographic groups most similar to Immigrants from Greece are Moroccan (14.7%, a difference of 0.20%), Immigrants from Panama (14.6%, a difference of 0.35%), Immigrants from Spain (14.5%, a difference of 1.0%), Yuman (14.9%, a difference of 1.1%), and Immigrants from Ukraine (14.9%, a difference of 1.1%).
| Demographics | Rating | Rank | No Vehicles in Household |
| Pima | 0.0 /100 | #292 | Tragic 14.1% |
| Immigrants | Jamaica | 0.0 /100 | #293 | Tragic 14.2% |
| Belizeans | 0.0 /100 | #294 | Tragic 14.3% |
| Paraguayans | 0.0 /100 | #295 | Tragic 14.4% |
| Immigrants | Spain | 0.0 /100 | #296 | Tragic 14.5% |
| Immigrants | Panama | 0.0 /100 | #297 | Tragic 14.6% |
| Moroccans | 0.0 /100 | #298 | Tragic 14.7% |
| Immigrants | Greece | 0.0 /100 | #299 | Tragic 14.7% |
| Yuman | 0.0 /100 | #300 | Tragic 14.9% |
| Immigrants | Ukraine | 0.0 /100 | #301 | Tragic 14.9% |
| Haitians | 0.0 /100 | #302 | Tragic 14.9% |
| Immigrants | Western Africa | 0.0 /100 | #303 | Tragic 15.0% |
| Immigrants | Russia | 0.0 /100 | #304 | Tragic 15.1% |
| Immigrants | China | 0.0 /100 | #305 | Tragic 15.2% |
| Immigrants | Belize | 0.0 /100 | #306 | Tragic 15.4% |