Paiute vs Houma No Vehicles in Household
COMPARE
Paiute
Houma
No Vehicles in Household
No Vehicles in Household Comparison
Paiute
Houma
11.8%
NO VEHICLES IN HOUSEHOLD
1.8/ 100
METRIC RATING
250th/ 347
METRIC RANK
11.5%
NO VEHICLES IN HOUSEHOLD
4.7/ 100
METRIC RATING
233rd/ 347
METRIC RANK
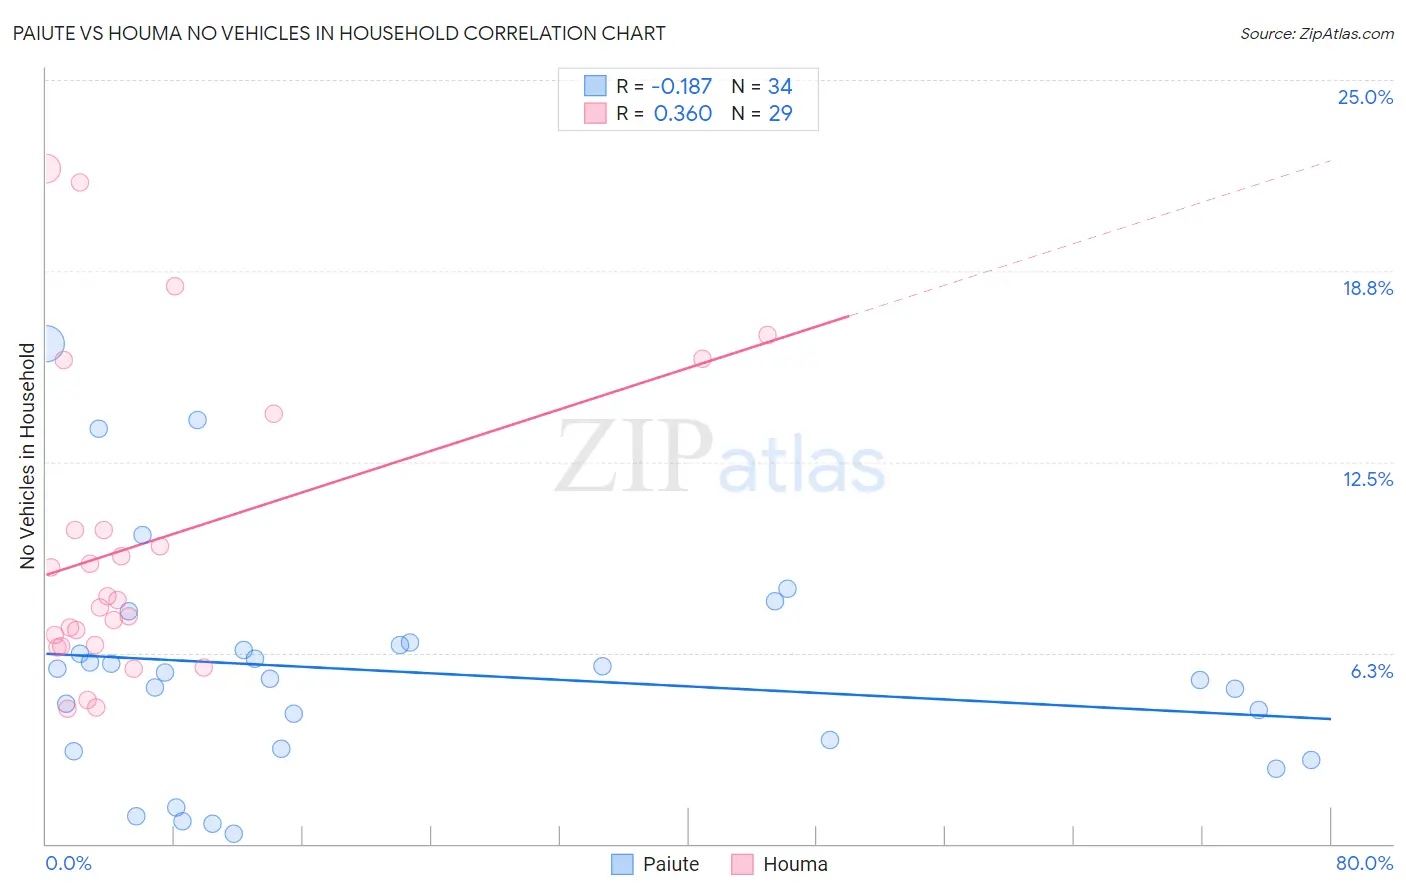
Paiute vs Houma No Vehicles in Household Correlation Chart
The statistical analysis conducted on geographies consisting of 58,352,157 people shows a poor negative correlation between the proportion of Paiute and percentage of households with no vehicle available in the United States with a correlation coefficient (R) of -0.187 and weighted average of 11.8%. Similarly, the statistical analysis conducted on geographies consisting of 36,780,476 people shows a mild positive correlation between the proportion of Houma and percentage of households with no vehicle available in the United States with a correlation coefficient (R) of 0.360 and weighted average of 11.5%, a difference of 3.1%.
No Vehicles in Household Correlation Summary
| Measurement | Paiute | Houma |
| Minimum | 0.32% | 4.4% |
| Maximum | 16.4% | 22.1% |
| Range | 16.0% | 17.7% |
| Mean | 5.6% | 9.9% |
| Median | 5.5% | 8.0% |
| Interquartile 25% (IQ1) | 3.1% | 6.5% |
| Interquartile 75% (IQ3) | 6.5% | 12.2% |
| Interquartile Range (IQR) | 3.4% | 5.7% |
| Standard Deviation (Sample) | 3.7% | 5.0% |
| Standard Deviation (Population) | 3.6% | 4.9% |
Demographics Similar to Paiute and Houma by No Vehicles in Household
In terms of no vehicles in household, the demographic groups most similar to Paiute are Immigrants from Nigeria (11.8%, a difference of 0.22%), Immigrants from Czechoslovakia (11.8%, a difference of 0.26%), Immigrants from Belgium (11.8%, a difference of 0.26%), Menominee (11.8%, a difference of 0.32%), and Black/African American (11.9%, a difference of 0.35%). Similarly, the demographic groups most similar to Houma are Immigrants from Turkey (11.5%, a difference of 0.040%), Immigrants from Peru (11.5%, a difference of 0.19%), Immigrants from Japan (11.4%, a difference of 0.23%), Kiowa (11.5%, a difference of 0.57%), and Cree (11.6%, a difference of 0.92%).
| Demographics | Rating | Rank | No Vehicles in Household |
| Immigrants | Japan | 5.1 /100 | #231 | Tragic 11.4% |
| Immigrants | Turkey | 4.8 /100 | #232 | Tragic 11.5% |
| Houma | 4.7 /100 | #233 | Tragic 11.5% |
| Immigrants | Peru | 4.5 /100 | #234 | Tragic 11.5% |
| Kiowa | 4.0 /100 | #235 | Tragic 11.5% |
| Cree | 3.5 /100 | #236 | Tragic 11.6% |
| Ute | 3.3 /100 | #237 | Tragic 11.6% |
| Russians | 3.2 /100 | #238 | Tragic 11.6% |
| Taiwanese | 2.8 /100 | #239 | Tragic 11.7% |
| Immigrants | Immigrants | 2.7 /100 | #240 | Tragic 11.7% |
| Eastern Europeans | 2.7 /100 | #241 | Tragic 11.7% |
| Turks | 2.6 /100 | #242 | Tragic 11.7% |
| Cheyenne | 2.4 /100 | #243 | Tragic 11.7% |
| Immigrants | Portugal | 2.2 /100 | #244 | Tragic 11.7% |
| Immigrants | Honduras | 2.1 /100 | #245 | Tragic 11.8% |
| Menominee | 2.0 /100 | #246 | Tragic 11.8% |
| Immigrants | Czechoslovakia | 2.0 /100 | #247 | Tragic 11.8% |
| Immigrants | Belgium | 1.9 /100 | #248 | Tragic 11.8% |
| Immigrants | Nigeria | 1.9 /100 | #249 | Tragic 11.8% |
| Paiute | 1.8 /100 | #250 | Tragic 11.8% |
| Blacks/African Americans | 1.6 /100 | #251 | Tragic 11.9% |