Immigrants from Bangladesh vs Latvian 2 or more Vehicles in Household
COMPARE
Immigrants from Bangladesh
Latvian
2 or more Vehicles in Household
2 or more Vehicles in Household Comparison
Immigrants from Bangladesh
Latvians
38.8%
2 OR MORE VEHICLES IN HOUSEHOLD
0.0/ 100
METRIC RATING
335th/ 347
METRIC RANK
56.2%
2 OR MORE VEHICLES IN HOUSEHOLD
83.6/ 100
METRIC RATING
140th/ 347
METRIC RANK
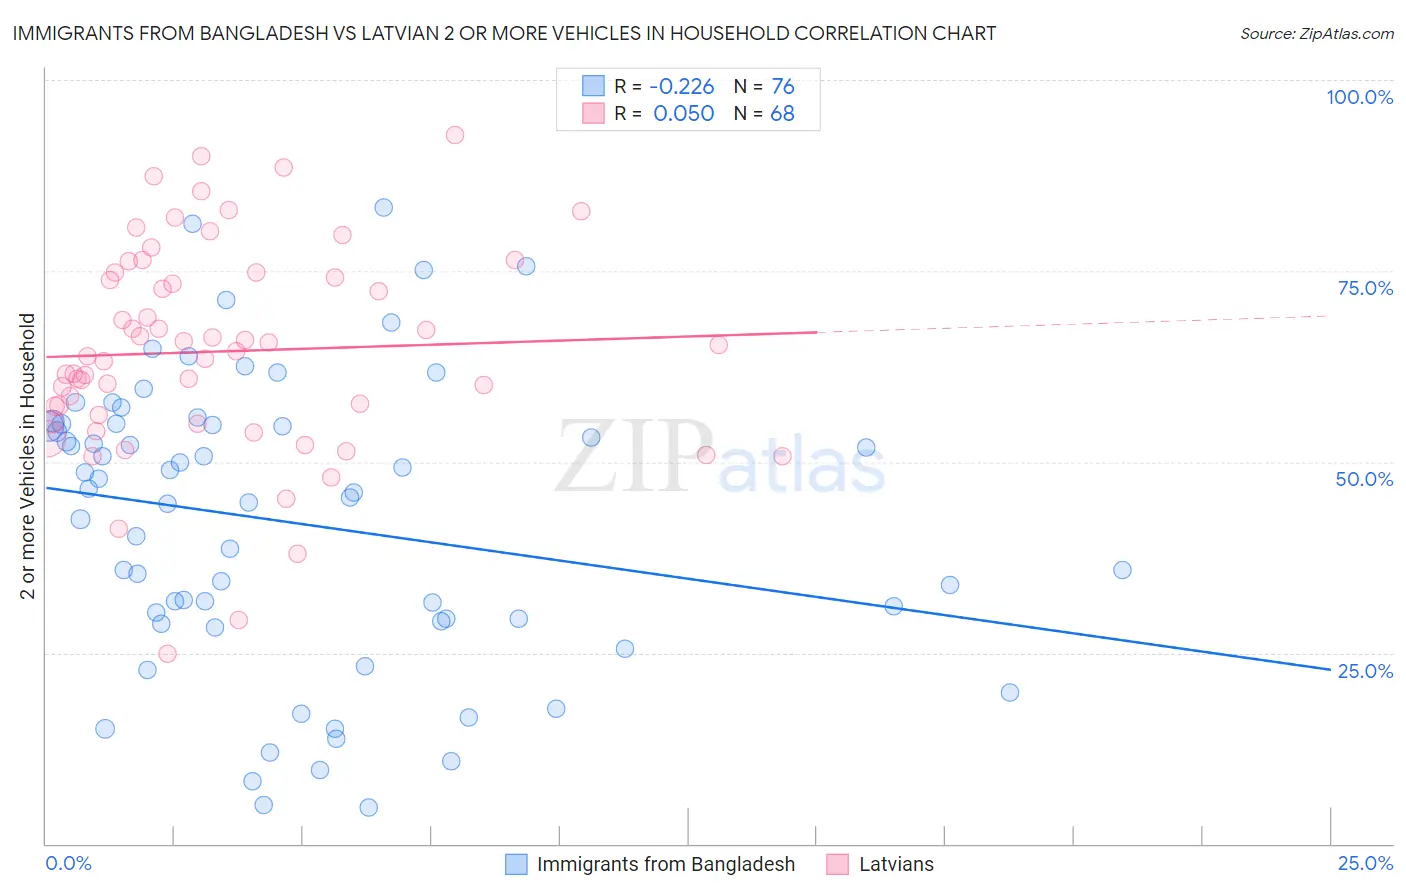
Immigrants from Bangladesh vs Latvian 2 or more Vehicles in Household Correlation Chart
The statistical analysis conducted on geographies consisting of 203,599,263 people shows a weak negative correlation between the proportion of Immigrants from Bangladesh and percentage of households with 2 or more vehicles available in the United States with a correlation coefficient (R) of -0.226 and weighted average of 38.8%. Similarly, the statistical analysis conducted on geographies consisting of 220,663,993 people shows no correlation between the proportion of Latvians and percentage of households with 2 or more vehicles available in the United States with a correlation coefficient (R) of 0.050 and weighted average of 56.2%, a difference of 45.1%.
2 or more Vehicles in Household Correlation Summary
| Measurement | Immigrants from Bangladesh | Latvian |
| Minimum | 4.7% | 24.9% |
| Maximum | 83.3% | 92.8% |
| Range | 78.7% | 67.9% |
| Mean | 42.0% | 64.5% |
| Median | 45.6% | 64.1% |
| Interquartile 25% (IQ1) | 29.2% | 55.7% |
| Interquartile 75% (IQ3) | 54.9% | 74.4% |
| Interquartile Range (IQR) | 25.7% | 18.7% |
| Standard Deviation (Sample) | 18.9% | 13.8% |
| Standard Deviation (Population) | 18.8% | 13.7% |
Similar Demographics by 2 or more Vehicles in Household
Demographics Similar to Immigrants from Bangladesh by 2 or more Vehicles in Household
In terms of 2 or more vehicles in household, the demographic groups most similar to Immigrants from Bangladesh are Vietnamese (38.5%, a difference of 0.72%), Barbadian (38.3%, a difference of 1.1%), Immigrants from Uzbekistan (37.9%, a difference of 2.3%), Immigrants from Trinidad and Tobago (40.3%, a difference of 3.9%), and Immigrants from Ecuador (40.5%, a difference of 4.5%).
| Demographics | Rating | Rank | 2 or more Vehicles in Household |
| Inupiat | 0.0 /100 | #328 | Tragic 42.6% |
| Ecuadorians | 0.0 /100 | #329 | Tragic 42.0% |
| Immigrants | Dominica | 0.0 /100 | #330 | Tragic 41.6% |
| West Indians | 0.0 /100 | #331 | Tragic 41.3% |
| Trinidadians and Tobagonians | 0.0 /100 | #332 | Tragic 40.9% |
| Immigrants | Ecuador | 0.0 /100 | #333 | Tragic 40.5% |
| Immigrants | Trinidad and Tobago | 0.0 /100 | #334 | Tragic 40.3% |
| Immigrants | Bangladesh | 0.0 /100 | #335 | Tragic 38.8% |
| Vietnamese | 0.0 /100 | #336 | Tragic 38.5% |
| Barbadians | 0.0 /100 | #337 | Tragic 38.3% |
| Immigrants | Uzbekistan | 0.0 /100 | #338 | Tragic 37.9% |
| Immigrants | Barbados | 0.0 /100 | #339 | Tragic 35.8% |
| British West Indians | 0.0 /100 | #340 | Tragic 35.4% |
| Guyanese | 0.0 /100 | #341 | Tragic 35.4% |
| Dominicans | 0.0 /100 | #342 | Tragic 35.3% |
Demographics Similar to Latvians by 2 or more Vehicles in Household
In terms of 2 or more vehicles in household, the demographic groups most similar to Latvians are Immigrants from Cambodia (56.2%, a difference of 0.0%), South African (56.2%, a difference of 0.040%), Armenian (56.3%, a difference of 0.050%), Salvadoran (56.3%, a difference of 0.080%), and Cuban (56.3%, a difference of 0.090%).
| Demographics | Rating | Rank | 2 or more Vehicles in Household |
| Comanche | 88.4 /100 | #133 | Excellent 56.5% |
| Immigrants | Azores | 86.6 /100 | #134 | Excellent 56.4% |
| Blackfeet | 86.5 /100 | #135 | Excellent 56.4% |
| Immigrants | Asia | 86.0 /100 | #136 | Excellent 56.3% |
| Cubans | 84.8 /100 | #137 | Excellent 56.3% |
| Salvadorans | 84.7 /100 | #138 | Excellent 56.3% |
| Armenians | 84.3 /100 | #139 | Excellent 56.3% |
| Latvians | 83.6 /100 | #140 | Excellent 56.2% |
| Immigrants | Cambodia | 83.6 /100 | #141 | Excellent 56.2% |
| South Africans | 83.1 /100 | #142 | Excellent 56.2% |
| Seminole | 81.7 /100 | #143 | Excellent 56.2% |
| Immigrants | Syria | 81.4 /100 | #144 | Excellent 56.2% |
| Syrians | 81.2 /100 | #145 | Excellent 56.2% |
| Venezuelans | 80.7 /100 | #146 | Excellent 56.1% |
| Serbians | 80.3 /100 | #147 | Excellent 56.1% |